Prior to the Open of Friday’s shortened trading session there was not much in the way of fresh news catalysts. So my first trading choices were second and third day plays. For those of you who are new to the SMB Blog you can use the “search” feature on the blog to review posts explaining how and why we trade “second day” plays.
NFLX was at the top of my list for potential shorts. Earlier in the week fresh news had caused it to gap down to 69 and it rallied about 4 points from this price. As a short term trader I am highly attuned to prices from which a stock rallies or gets crushed in the preceding trading days. I have found over the years that these prices generally offer the greatest risk/reward entries for intraday and multi-day swing trades.
Take a look at a 15 minute multi-day chart for NFLX for last week. I have highlighted two price levels with horizontal line segments. The line segment at 69 is a reminder that NFLX rallied from this level and is a dangerous short if it is trading above this level. The second line segment at 68.50 is where NFLX supported the morning of the second trading day after the news was released as well as that day’s closing price. If NFLX were to hold below this price level it could be the beginning of a move lower.

Screenshot from Friday’s Gameplan which is a written summary of stocks discussed in the AM Meeting prior to the market’s Open each day.


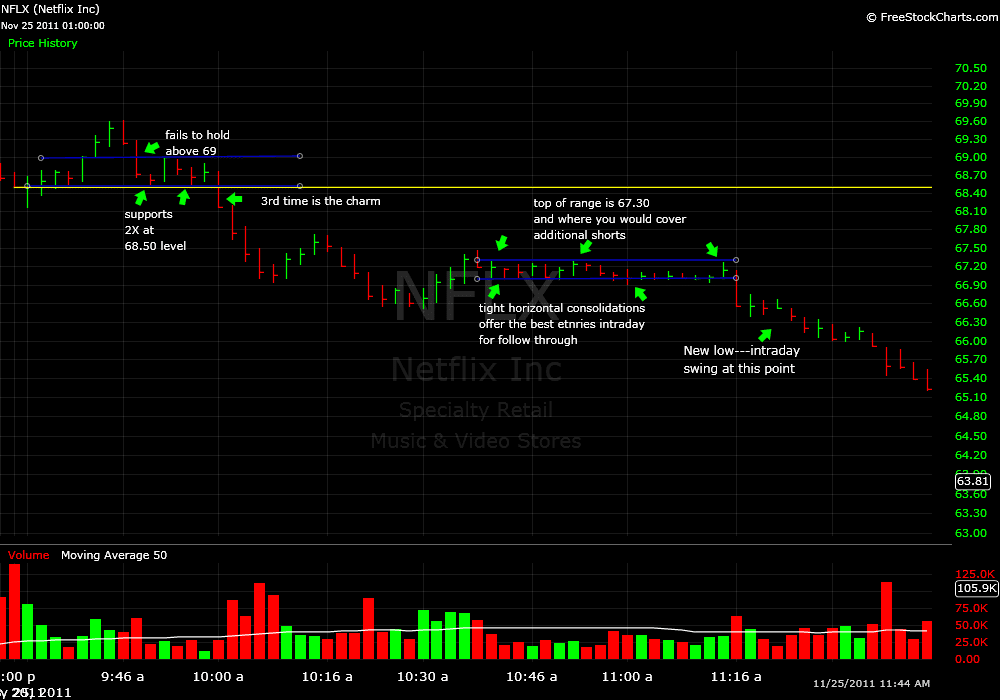
Take a look at the 2 minute chart below from Friday’s price action. NFLX traded above both of the highlighted resistance levels from the AM Meeting, but notice that it fails to hold above 69 and then spends the next ten minutes bouncing between 68.50 and 69. This failure to hold a bid above 69 for more than a few minutes on the Open is a signal for more aggressive traders to initiate a small short position. At 10:00AM when it breaks below 68.50 on heavy volume there is further evidence that a significant down move may be in the cards, and this is where a more conservative trader could initiate a short position.
I have further marked up the chart to highlight the tight horizontal consolidation where traders could start to build larger short positions with very well defined risk.


Disclosure: No relevant positions
Steven Spencer is the co-founder of SMB Capital and SMB Training and has traded professionally for over 15 years. His email is [email protected]
4 Comments on “Using Prior Days’ Price Action–NFLX”
Solid trade, Clear downtrend, clearly defined risk, thanks Steve
S4 support on NFLX is almost exactly where the historic breakout to 30 hundred started.
i meant 300
good stuff as usual steve. curious to your trade management once you’re in a winner. i believe you have said your a peeler on winner- you peeling at risk reward in 1:1 zone or higher on first piece or is it a function of tape and chart action? are you discretionaly exit on last piece you hold or you let a level/ma or some other method trail stop you out to capture the grand salami type of move
thanks