I have had some things going on that have affected my trading over the past several months. For one, I have been putting an enormous amount of time and thought into building a new Advanced Technical Analysis training product that SMB will be unveiling somewhere down the road. More on that later, but it has made me really think about my trading, how to distill technical principles down to the essentials that can be easily taught, and then (much more difficult) how to put it all together with a sense of the big picture. This is a tall order, but I think I’ve made some good progress and we will soon have a training module that will really be very exciting.
These blog posts over the past several weeks have been an outgrowth of that process, so you already have a peek into some of the material. I also have been trading only SPY for more than a month, which has forced to to focus on absolutely pure technical trading. As I’ve been thinking about transitioning back into trading a mixture of market and stocks, I was looking for an easy “lay-up” play when one presented itself in RIMM Friday morning, on what was an otherwise crappy pre-holiday trading day.

Overnight post-earnings announcement in RIMM
The chart above shows the after-hours action when RIMM reported Thursday (9/16/10) night. (To be clear, I did not see the action at the time because I was at the dentist (fun, fun), but this was my analysis and thought process Friday morning.) Also, this chart is a 1000 tick chart. I find that tick charts are extremely useful for pre or post market stocks and for extremely in play stocks because of the way they aggregate market action into more readable patterns than pure bar charts. If you have any doubt, compare the chart I posted to a 1,3 or 5 minute chart of the same time period and see which paints a better picture.
A- Immediate reaction to the announcement spikes RIMM up to around 50.80, followed by immediate price rejection. This obviously is now the key level to watch.
B – A 2-legged pullback (ABC trend move as per my previous blog post.)
C- a pause (= pullback) in the upmove off of B. Note that measured move objective would carry slightly above the highs.
D- another leg up (another ABC pattern… gee these seem to happen all the time… hmmm…) which finds resistance at the previous high. After a few bars, another instance of price rejection.
E- and now the crucial moment. Will this low at E hold as a higher low, and the market go back to test the highs? If so, we are consolidating a the highs which would then likely break. If not, the other way this could likely resolve would be for an ABC leg down. The selloff is massive, extending far past the MMO (measured move objective)
F – a test of a possible double bottom around 47.60 just before the open.
So this was the setup coming into the open. If the (F) double bottom holds, there is a good chance we could make a lot of headway to re-test the highs. On the other hand, if this (F) double bottom is broken, look out below…

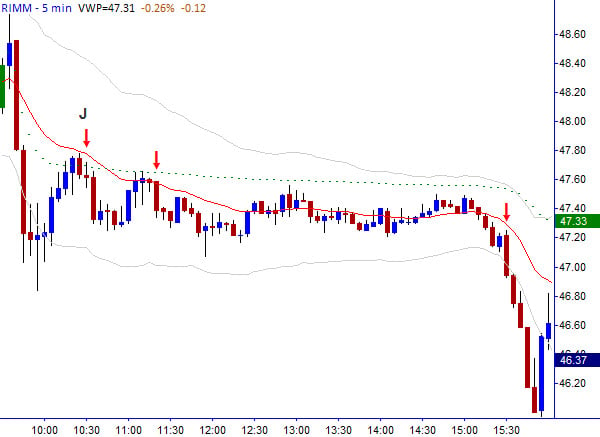
The setup
(Note the different colored candles distinguish between premarket and regular session. Also, this chart is now a 5 minute chart, which is how I look at stocks intraday.)
G – So the stock opens well above (F), but immediately sells off, through the level and gap fill is looking like a good possibility.
H – a lot of action around the day’s low, and then a consistent upmove for about half an hour…
I – which carries the market to three interesting technical levels: 1. the exact 50% retracement of the day’s range, 2. slightly through VWAP and 3. to the 20 period exponential moving average. This is certainly an area where we could expect the market to turn back down for at least another shot at the lows. I decide that this is as close to a technical layup as I am ever going to see: it’s a pullback (which is the best, highest-probability technical play there is) supported by the big picture in an in-play stock also supported by several minor technical factors. To put the icing on the cake, I wait for the momentum to shift so I now have confirmation from the shortest term trend and I short a medium sized position.
At this point, at 10:46 I tweeted: “Measured move for RIMM short is around 45.90” which I got from taking the high and low of the day, and extending that down from the high set at (I). (Yet another ABC wave application…) I thought it would be a stretch on what would probably be a quiet pre-holiday day, but also thought that gap fill could provide a good tailwind for the trade so it was worth a shot.

how the trade developed
So here you can see the rest of the day. I shorted (J), held most of that the entire day, and also added smaller positions at the other arrows. The last trade was a short out of a very small consolidation (another pullback pattern) as the afternoon support was broken. The low of the day was 45.97, a few cents short of the target I tweeted in the morning, but that’s close enough for that kind of target.
This is certainly One Good Trade from a technical perspective and, though it is not common to have all of these supporting factors, the pullback trade is One Good Trade you can make over and over again.
Follow me on twitter (AdamG_SMB) as I will try to tweet information on developing market structure and plays like this through the trading day.
6 Comments on “Decoding Pullbacks: A Case Study in RIMM Post-Earnings (9/17/10)”
Great post on illustrating what developing traders try to do intuitively but can not seem to put a thought process behind.
One question I do have is how would you deal with spikes above J? I think you would often find yourself in this position in NASDAQ stocks. Your thought process on exiting it or being temporarily red in the trade would be much appreciated.
Thanks Eric.
A) I don’t really see that NASDAQ stocks trade all that differently than listed stocks. (or, from a technical basis, futures, forex or commodities…)
B) I would have been stopped out. put on the trade, put your stop in the right place, manage the trade, repeat. If stopped out on an obvious spike I might re-establish, but that costs me money on balance. Your job is not to be in the trade, it’s to trade the pattern. Keep it simple.
An interesting post… RIM was set up to fail by the time it opened… your analysis demonstrates this well, despite the bullish optimism shown by some investors.
I’m very focused on keeping it simple and making layups on a daily basis. If the pullback trade is the OGT we should be making all the time, then we should be focused on looking for stocks that are likely to give us these pullbacks.
Right now the criteria I’m using is:
-In play due to news
-Gap up or down (which gives us the out of balance condition that will move the stock)
Any other ideas?
Eric:
Be careful with gaps. yes they are often a great setup but sometimes there can be a good gap and then the stock just sits at “THE PRICE” it finds… kind of triangles and consolidates for the rest of the day and doesnt move until the next day really. I thought this actually might have been what was going on with RIMM that day… lots of people on the desk got flat in the middle of the day and I really don’t think that was a mistake. I was holding mostly because of my opinion on what the overall market might do.
Pullbacks happen in pretty much every stock every day. It’s much more important to understand all the nuances of the pattern that to have selection criteria for pullback stocks. If it’s trending, there will be pullbacks, and most reasonably in play stocks trend at some point in the day. The key is really understanding the pattern.
Thanks Adam, great insights. Will be thinking about this tonight in preparation for this week.