*****Editor’s note: Jake Huska is a college student working on his trading game. At SMB we believe traders should start working on their trading game early, just like pro athletes. Jake’s posts reflect a better journey to pro trader for the college student with a passion for trading.*****
There is a saying along the lines of “Good traders know their upside while great traders know their risk.” In essence, great traders are risk assessors. Understanding your risk is an imperative component of trading on any time frame (others include skill development, psychology, etc.). Generally, as you increase your time frame the greater your profit targets and your stop losses become, at least in dollar terms. While a longer-term trader may be risking $5 per share looking to make $25 per share, an intraday trader may be risking 10-20 cents per share trying to make as much as a $1. This difference is simply due to the difference in likely profit targets between these two time frames. With that said, notice that both strategies represent a minimum risk-to-reward ratio of 5x.
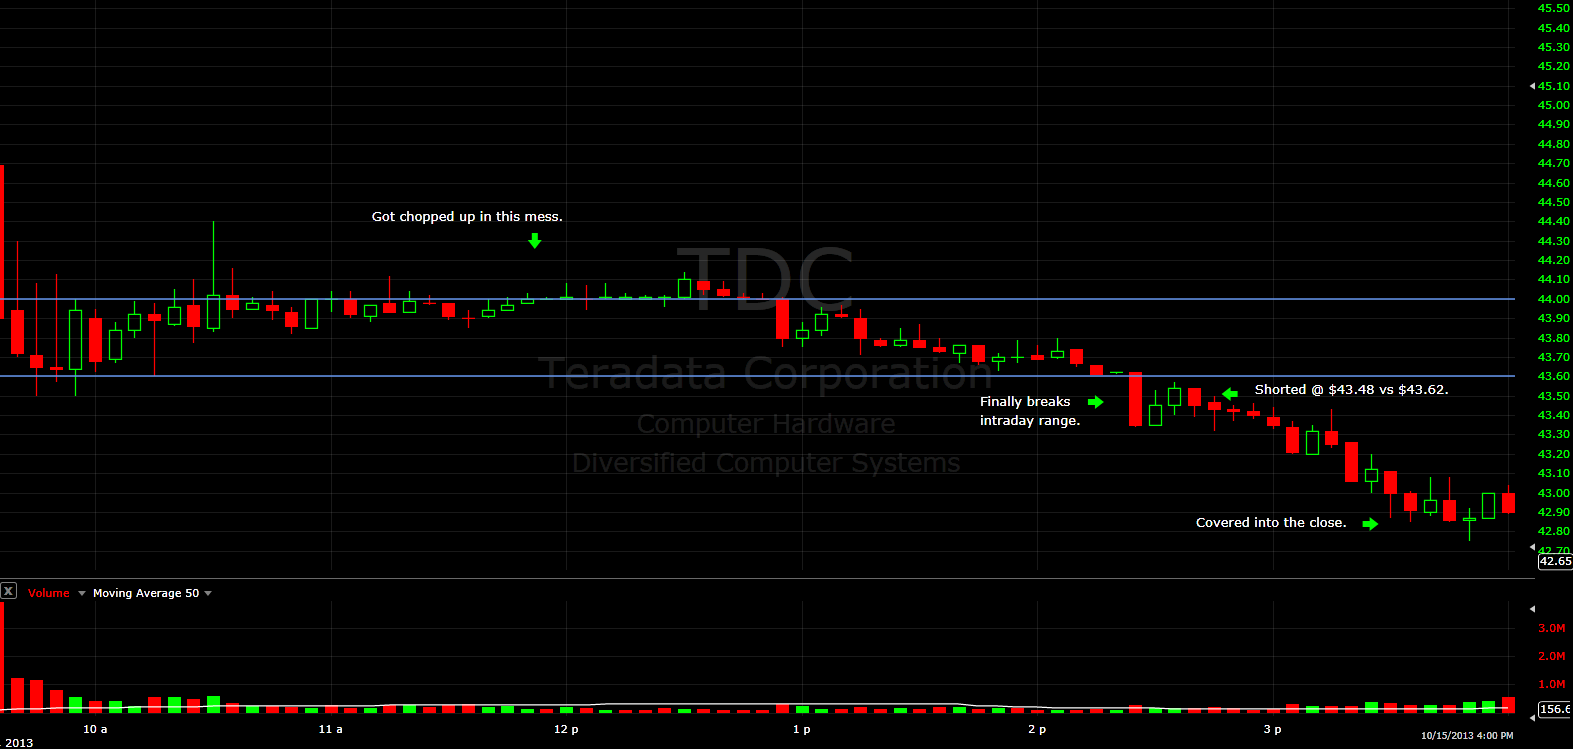
I wanted to share two trades of mine on completely different time frames. One is an intraday trade, the other is a longer-term swing trade. The intraday trade is TDC, which I traded on Tuesday (10/15/13). While I initially got a little chopped up in the stock, once it started to trend there was a nice opportunity to the short side. Once the stock finally got below $43.60 intraday, I got short @ $43.48 with a stop loss of $43.62. So I was risking $0.14 per share on this trade, and the stock was below all major support levels both on the daily and weekly charts. I ended up covering the trade into the close around $42.90, so this particular trade represented a risk-to-reward of over 4x (I believe the down move could’ve been greater if it had started earlier in the day).

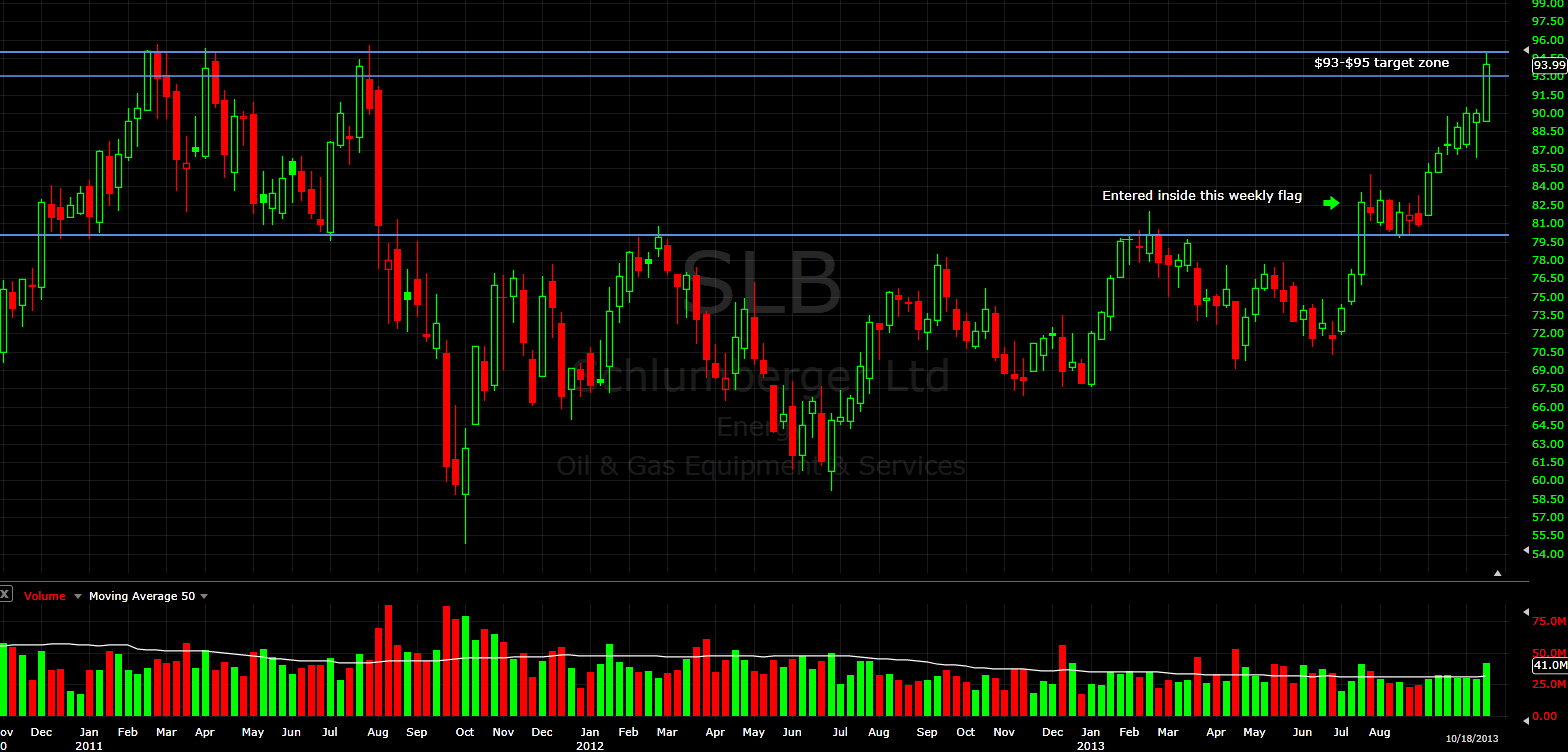
The longer-term swing trade that I made was in SLB. I liked how the stock was consolidating on the weekly chart after breaking above $80. Back at the beginning of August, I got long SLB around $82 with a daily stop loss below $79.80 (I have been trying to employ daily stop losses with my swings where my exits are triggered based on daily closing candles). So my risk was roughly $2.20 per share. As I mentioned on StockTwits, I also knew that my upside target was $93-$95, based on weekly resistance levels. This trade had a risk-to-reward ratio of more than 5x. With its recent earnings report, SLB has now met that $93-$95 target zone.
So while these two trades are distinctly different in time horizons, both display an understanding of knowing and understanding your risk compared to your reward. I thought both of these setups had a high probability of following through on their respective time frames.
So in which extreme does your trading fall? Are you the micro-scalper risking a penny or two intraday, or are you the longer-term trader risking $5? Perhaps somewhere in between? Maybe you’re a mixture of both? I would like to hear your thoughts.
Related blog posts:
Risk: SO Not Just a Game
Conviction Makes a Good Trader Great
No relevant positions