Tuesday night news hit that a government investigation determined that BP had been spilling closer to 60,000 barrels a day in the Gulf instead of the 35,000 previously thought. This same night President Obama delivered harsh words for BP during his presidential address. The news was very negative for BP heading into today’s session.
I started a short position after the news broke on the increased spillage findings. And I held this position overnight. I walked into another $1.50 in downside with BP as it opened near 30.
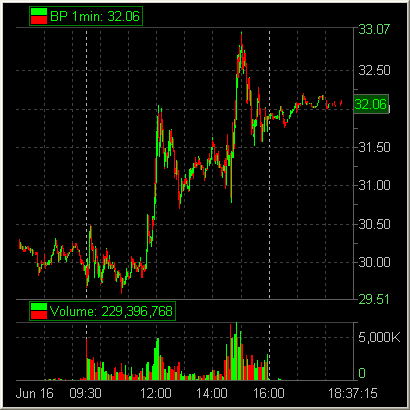
First BP traded lower. But at 29.70 the bid would not drop. BP found the whole number. Then came back towards the low but could not drop 29.75. There was so much buying on the tape in this 29.75-70 area.
BP bounced off of this open support and found 30.50. BP came back to test this area and held again. It did so a few more times. But then BP started to consolidate towards the low.
Finally BP broke below 29.70 and I hit 3k shares to get short. This would be the bottom. Let’s replay what happened and identify the reversal pattern.
Below 29.70 BP ticked to 29.60. Bids stopped getting hit at 60c. Not much of a downmove below such an important level for a Stock In Play. A bid stepped up to 66c and this bid was held. BP cleared 70c pretty easily. And then there was way too much buying on the bid at 71c and 72c and 73c. The 70c bid got hit once, but not that hard, and there was plenty of size on the bid left.

There are times when I advocate trading both sides of a stock. Meaning trading BP as a long above a certain level and short below the same level. I do not do this often. Only for special occasions with special stocks. And I am not much a fan for picking bottoms. But there are times for this. And Wednesday in BP was such a time.
Long 29.71 was a play for the intraday trader. BP failed to breakdown. There was massive rebuying at this important 29.70ish level.
This was your opportunity to start an Intraday Reversal Trade. You buy 29.71, your exit if the stop trades against you is if the 66c bid drops, and you hold for a Trade2Hold move to the upside. You cannot sell into the first upmove. You must hold. This play will not have a high win rate. The math will not work if you cannot hold for a substancial upmove. And this is challenging at the bottom. At the bottom stocks look their worst. Their is a crescendo affect that goes something like this: the stock looks awful, the stock looks weak, the stock is not strong, the stock is ok, the stock is good, the stock is great, the stock is awesome. You are in the play to capture the stock is awesome moves, perhaps multiple points higher.
Later BP found 32. Granted the move from 31 to 32 was helped by the announcement that BP agreed to set aside $20B for those affected in the Gulf. This is an intraday reversal pattern. Perhaps you can make this trade your own.
11 Comments on “An Intraday Reversal (BP)”
Bella:
I have 2 questions about the trade:
1. If the 66 bids drop again after it held, would you flip your long position to short?
2. Do you need to babysit the position after the entry, or can you comfortable set a stoploss below 66 and walkaway. It would consume alot of energy watching the stock for an hour and being ready to hitout anytime, as a momentum breakdown below the intraday low would not be pretty.
Regards,
Tapetrader
Bella,
Several questions with regard to specifics on managing this trade2hold.
1-The Math: Where must I sell this position before it makes sense mathematically?
2-If it missed $29.71, can I buy $30 with an out below $29.60? If not, what price would be the highest you would pay for this with the same exit strategy.
Thx!
Eric,
1. The first price to consider a sale is 30.50, where if failed from previously. Our charts indicated 32 was the next level. It is up to you how you sell, but a system that sells some at 30.50, scales out of some more up to 32, but still holds some until the intraday trend is broken might be a selling strategy for you to consider. But again you must determine your selling strategy for you.
2. You can certainly buy 30 if the bids show strength. It did fail there a few times previously so this entry is no where as good as 29.71. If you buy at 30 and use below 60c as a stop then you must play for a move to 32 IMO. But I am interested in your thoughts on this. What would be your exit strategy if you bought at 30 with a stop at 29.60?
Thxs for the comments.
Bella
Tapetrader,
Excellent questions.
1. I would get flat under 66c for a long. I would short below 60c. What makes sense to you?
2. As for watching the stock, I would set a stop below 66c, then switch to a longer term
chart and try and stay long as long as the uptrend was not broken. Would that work
for you?
Thxs for contributing.
Bella
Thx for the reply. The type of trading that has been working for me (after paying so much to mother market for my education) is finding support on the tape/charts and scaling into the position (in equal lots) for size. If i was good enough to get some at 29.71 I really want to add some more if I can find strength above 29.71. Considering how fast BP can move sometimes I wouldn't be too mad I missed 29.71 and got some around 30.
So now lets say I'm in 1 lot at 29.71 and another lot at 30. My stop is below 60 (with slippage probably into the 50's). My thought process on selling is really when the stock starts showing me weakness on the chart or the tape. I'll sell one lot into that and play with the house's money on my original lot. So if the weakness is a ton of selling at 30.10 I'll put my ego aside and take it there since I already have my original lot at a great price. If I sold the 2nd lot into heavey selling and it comes down to any price above 29.71 and looks like its holding, I'll surely buy back my 2nd lot but nothing more than that.
If I got my first lot at 30 I won't scale into it any more and my out will be at 29.60. My exit for this will be 29.60 or when the charts (not the tape) stop showing me strength.
You wrote an article awhile back about alot of V type patterns in the market where the charts clearly show support and algos taking stocks back to the support prices very often. I've taken this into account in most of my trades and if I'm getting a clean 50 to 75 cents I think I have done decent and am not afraid to start over from the original support price. I feel like stocks make multi-50 cent moves back and forth but finding multiple point moves are harder to find.
I tried to be as detailed as possible with my thoughts. Any and all are free to break it down and comment. Thx.
We will be discussing this trade more on SMB U for StockTwits TV this Sunday.
Eric,
I love the idea of you being aware of a V pattern. They can happen. Are you taking this a step too far by essentially determining your plan assuming a V pattern? Do you see the difference?
Great stuff working on your game!
Bella
Great questions Bella. I think I have taken it a bit far. Where I am likely selling 30.50 and scaling the rest out up to 31, you are selling your first lot at 30.50 and scaling out to 32 and higher.
I'll incorporate this into my trading plan for next week. Thx for taking the time to write the comment today, I can do some visualization over the weekend. Have a great one.
It was a awe-inspiring post and it has a significant meaning and thanks for sharing the information.Would love to read your next post too……
Thanks
Regards
Stock Tips
I read your post . it was amazing.Your thought process is wonderful.The way you tell about things is awesome. They are inspiring and helpful.Thanks for sharing your information and stories.
share tips
I really appreciate your post and you explain each and every point very well.Thanks for sharing this information.And I’ll love to read your next post too.
Regards:
Trading Tips