Thursday March 10th was a day many traders had circled on their calendars. Often the greatest short term trading opportunities will occur on days where major economic news is announced. The monthly jobs number, quarterly GDP, FED rate decisions and ECB monetary policy fall into this category. Thursday the ECB was set to announce what steps it was planning to take to offer continued stimulus for the EU. The context of this decision was that it was set to occur after several strong weeks in the US stock market.
When you watch financial TV or listen to financial punditry there is a lot of time spent trying to explain why the market goes up or down based on a particular data point. But as traders we understand that our focus should always be on the price action following the announcement rather than its substance as well as considering the higher time frame state of the market at the time. The SPY has been in a strong up trend since bottoming on February 11th.

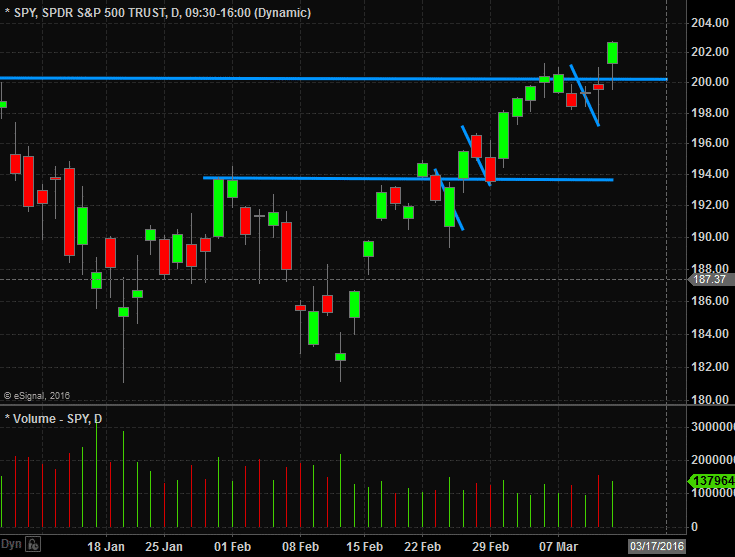
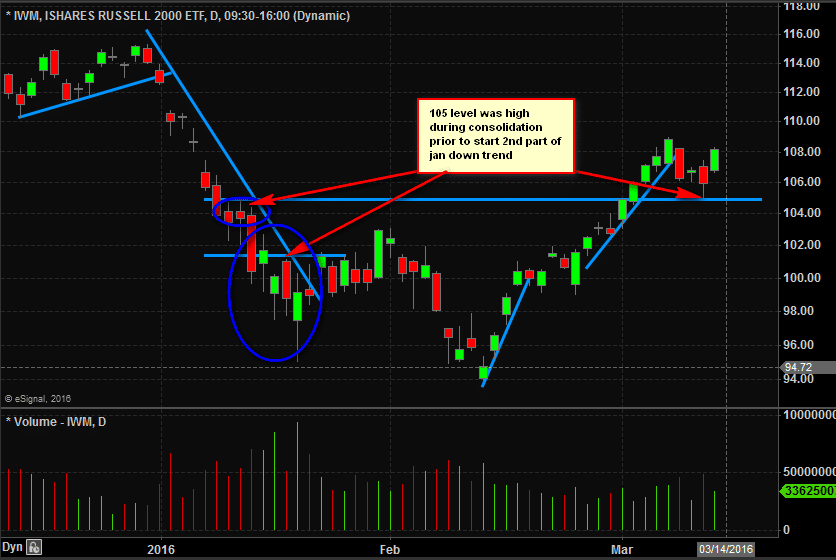
The three blue dashes in the chart above represent each 2%+ market pull back since February 11th. From pull back low to the following day high we have averaged more than a 50 handle move. We are in the midst of a very powerful market up trend in large cap stocks. This is the context in which I bought the SPY pull back on Thursday (the middle pull back appears smaller than it was as it doesn’t show pre/post market trading).
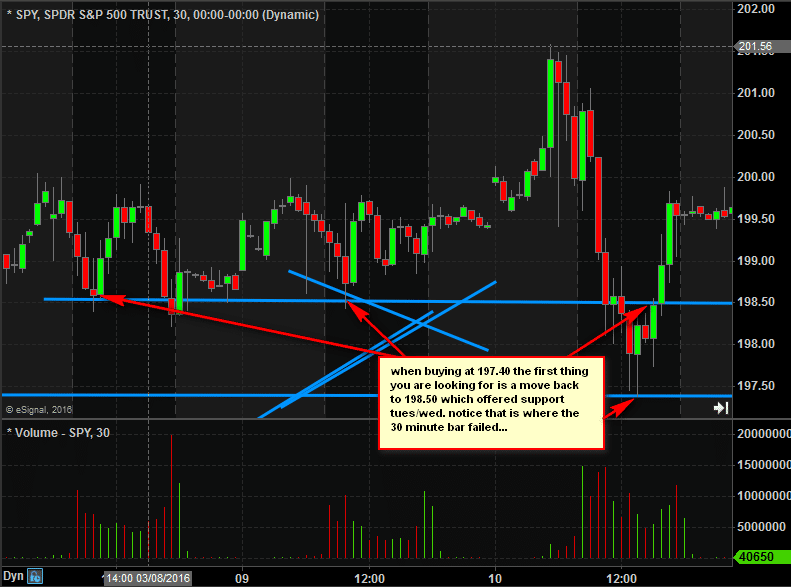
From an intra-day perspective buying 40 handles off the morning high will give you a bounce the vast majority of the time. So even if we weren’t going to have a full reversal we had 10 handles of upside to the support area from the prior two days as you can see here (197.50-198.50).
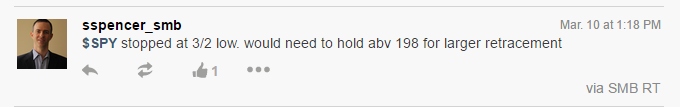
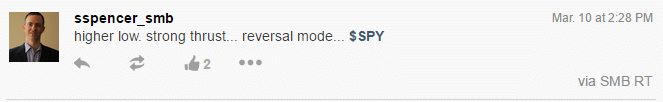
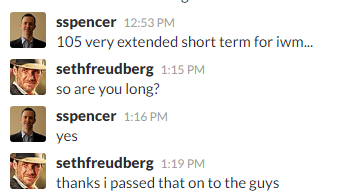
Here are some things I tweeted as the market began to bounce.
By 2:30 the market had a strong thrust towards 198.50 and I began to think about the possibility it could push towards 199.50-200 which had been a prior support area
The move above 199 in the final hour was enough evidence for me that we could test the March high on Friday.
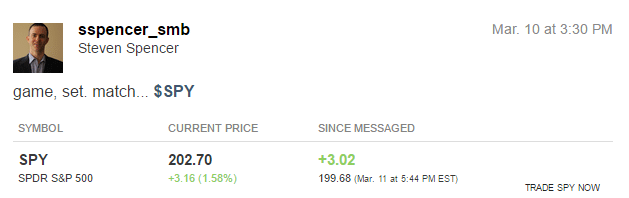
Friday we closed at 202.70 so another $1 to fill the gap that began the year.
__________________________
The IWM trade was a bit different for me than SPY. There was no “typical” pull back pattern that had emerged since the February bottom. The largest factor in my thinking related to the magnitude of its recent uptrend. On a percentage basis IWM had moved up about 1.5X more than SPY since the February lows but its most recent up trend from 102 to 109 was historic in nature. During the same time period SPY had moved up less than 1/2 as much on a percentage basis. So my thought was as IWM (small caps) started to show relative weakness to the SPY it could drop out 2X a SPY pull back or 4% vs. 2% for SPY. A 4% pull back from its recent high lined up with the 105 price level a spot where it topped out on 1/12 before beginning its next leg lower to 95.
The above analysis is probably unique to myself and perhaps just a bunch of trading “voodoo”. Nevertheless I started buying IWM at 105 and communicated this to the head of our options desk as a spot to potentially hedge off some of our bearish longer term RUT options positions (IWM is the ETF representative of the RUT).
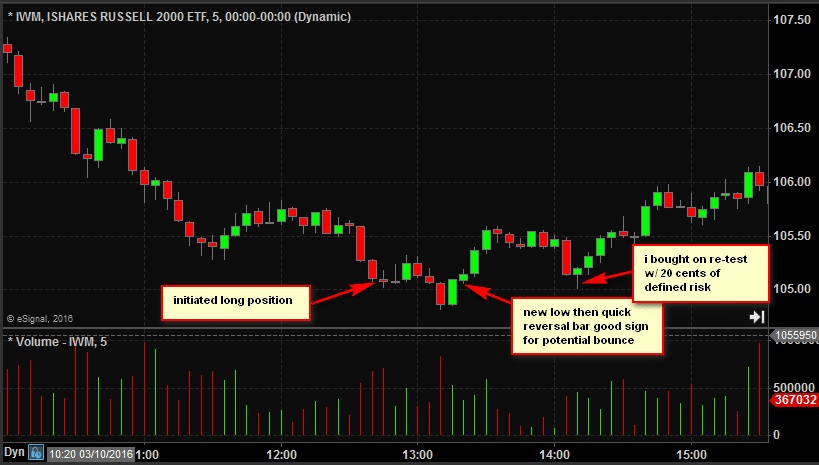
Here is an intra-day view of the IWM price action. The re-test of 105 was quick and looked scary but offered a well defined stop below the intra-day low for a more conservative trader. Every morning we discuss these setups in our AM Meeting and you can see the positions being put on live in SMB Real Time. More info HERE

Steven Spencer is the co-founder of SMB Capital and SMB University which provides trading education in stocks, and options. He has traded professionally for 19 years. His email address is: [email protected].
No relevant positions