I have noticed recently a lot of money being made on the desk via reversal patterns. A reversal pattern is when a stock that has trended in one direction stops trending and then begins a new trend in the opposite direction. Reversal patterns can be much easier to trade than the initial trend as they usually unfold over a longer period of time and may present several consolidation areas allowing a trader to build a larger position with well defined risk.
Let’s take a look at two stocks that offered reversal patterns this week. I was involved with both stocks and each of them presented very clear clues that a new trend might be forming. The first is NAV which I blogged about last week here. On Tuesday morning a large seller emerged in the stock causing it to trend down for several points. The selling was heavy and consistent. Once the seller was finished you could see a very clear drop off in volume and a change in the price action.
This 15-minute chart illustrates very clearly how once a large seller had completed their order the price action changed.
")
As a trader I am most focused on volume and price. In the case of NAV there was a huge drop off in volume that coincided with a stabilization of price. A stabilization of price occurs when there is equilibrium between buyers and sellers. The completion of the large sell order led to this equilibrium and horizontal movement for about an hour. This caused me to nibble on the long side. Eventually more buyers emerged and a higher level of consolidation was established increasing the likelihood that the reversal trade will work.
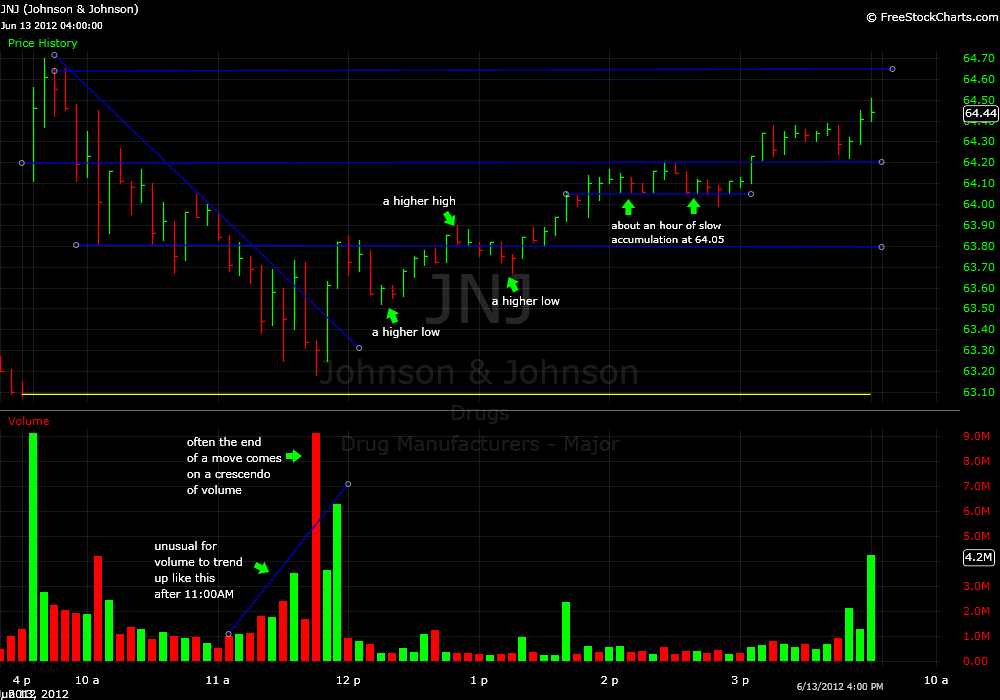
The next stock that had a reversal pattern was JNJ. Normally a very tame and liquid stock JNJ had some of the wildest price action Wednesday morning I have scene in awhile. They announced a massive accelerated buyback of their own shares and there was a large pre-market gap higher. By around 10:00AM the sellers were in control and the stock trended lower for two hours.
The reason I used this as an example was it illustrates very well the idea that trends will often end with a crescendo of volume. Notice in the five-minute chart below that the volume peak coincided with the low print for the day. Also from 11:00am to 12:00pm the volume had been steadily increasing. And at noon the volume collapsed and the downtrend was broken.

One of the great things about the reversal pattern is that usually there is no rush to open a position. The reversal is slow to develop and you will receive clues that the initial trend is over and during the next hour or so you will see price action confirming your thesis and offering a higher probability entry. In this case after JNJ put in its crescendo low the next two pullbacks the stock had resulted in higher lows. By that point I was fairly confident JNJ was reversing and heading north of 64.
These two setups and other similar reversals patterns are discussed live in “SMB Real Time” each trading day.

Steven Spencer is the co-founder of SMB Capital and SMB University and has traded professionally for 16 years. His email is [email protected].
No relevant positions

4 Comments on “Reversal Rehearsal”
For some reason I’m awful at recognizing reversal trades. Always get the feel that I’m fishing for a top/bottom. Will need to review this thoroughly. Thanks
For some reason I’m awful at recognizing reversal trades. Always get the feel that I’m fishing for a top/bottom. Will need to review this thoroughly. Thanks
How long the rollback could continue? For example $BKE and $EDU have shown something like reversal pattern that you described (but without volumes on falling), and rollbacks have not developed.
$BKE and $EDU have shown something like reversal pattern 30.06.12