This is a followup to my posts (here, here and here) examining some relationships between random data and market data. I’m sure many of our readers were surprised to see patterns in randomly generated data that looked like real market data. Random datasets have trends, appear (on casual inspection of the charts) to respect support and resistance, and also show many of the chart patterns that technical traders tend to look for. In those posts, I gave you the bad news, which is that a lot of what goes in on the marketplace is probably more due to random fluctuations than we would like to believe. However, stock prices are not the product of a random number generator, but rather the end result of buying and selling decisions made by human beings who are basing these decisions on a combination of intellectual analysis and emotional reactions. There are some quantifiable non-random elements in market data, and some of those can be used as the basis for profitable trading strategies.
In the answer key to the random charts, one of the criteria I gave was: “For instance, volatility is often identifiable as a non-random element. Volatility shocks (an academic term, but a useful one. Think of a quiet market reacting to sudden news.) tend to persist. What this means from a practical standpoint is that the ranges of bars usually fluctuate in less-than-random ways: A sudden large bar will usually be followed by more large bars and vice versa.” There are a number of models that capture this tendency. Some of the better-known are the ARCH, GARCH and EGARCH (exponential generalized autoregressive conditional heterskedastic models…. try saying that three times fast.) models which expand on my random coin flip model by modifying the volatility of the model to match what happens in real markets a little bit better. Essentially, the ARCH family models set the volatility of a price series based on the volatility of recent history — volatile markets tend to have more volatility in their future and quiet markets tend to stay quiet until some random volatility shock (think new information like an earnings announcement) hits the market.
The ARCH models are certainly a little academic (and, frankly, outdated), but I think there is an important practical lesson that you can take into your own trading. When a quiet market makes a big move (i.e. suddenly becomes more volatile), your best bet is to bet on future volatility being relatively high. It is unusual for a market to become volatile and them immediately go dead again. Volatility shocks tend to persist. Big moves give rise to more big moves.
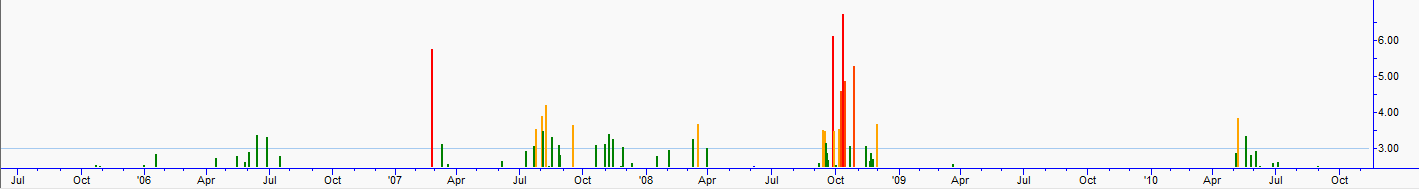
An important caveat is that this kind of volatility is non-directional. A market can make a big move up, and then have a period of volatility that is up, down, or sideways. You can incorporate this into your analysis in various ways, and realize that there are instruments (options) that allow you to actually trade the volatility itself. I decided to share a few charts that illustrate this principle in a simple way. Most of our readers have probably have never seen charts like the ones attached, but these are charts of the cash S&P index that express each day’s price change as a standard deviation of the last year’s realized (historical or statistical) volatility. I wanted to make the charts focus on larger price moves, so everything below 2.5 standard deviations is cut off, and the charts display absolute values of price changes. We see something very interesting in these charts strange looking charts: volatility clustering. Big price spikes tend to cluster around other big spikes, and are interspersed with long periods without any big price spikes. Go back through these charts and think about what news items were driving volatility in those periods where we see large clusters of spikes, and think about how you might have incorporated knowledge of volatility clustering in your market analysis. From a quantitative perspective, this is one of the most important non-random elements in market behavior. Many discretionary traders will find this to be a valuable additional to their analytical toolset as well.


3 Comments on “Volatility Clustering: Unveiling the Non-Random Nature of Markets”
Are you using any academic models to forecast volatility?
Outstanding! Outstanding, outstanding, I was hoping there for a second you were going to let some cats out of the bag on some quant firms. Shucks, but regardless, you have done such a great job with this series, Adam. Truly. I think most of the people who read this legitimately came away with a fundamental critique of technical analysis. The reality is simply that there are very few strategies that would withstand the challenges you laid down in this series.
Without a doubt, if any technical trader reads this blog, you make them reflect on what a “high-probability trade” really is. Reflect *anew.* There are so many traders who need to read what you have written- I hope you know that. There are thousands of salespeople who preach basic pattern recognition and they have so many followers, it is so disheartening! I sat next to a few ladies at the Traders’ Expo who were nodding and – I kid you not – saying “amen” to a trader who was pointing out that the market would likely go to point A because of support B and trend C. I felt beside myself.
Once again, bravo!
so what are then the rules to use such a volatility change ? when to go long ? or short?