Let’s play a game. Imagine we have before us the proverbial “fair coin”, and we decide to flip that coin 1,000,000 times. When it comes up heads, I will pay you $1, and, of course, when it comes up tails you will pay me $1. We will keep a running total of your “P&L” on every turn of this game. Simple, right? Please think about this question before you read further:
- How much do you expect to make or lose at the end of this game? (Come up with an actual dollar amount.)
This is obviously a game where neither of us has an edge, so the 20 days or so it takes us to play this game are totally wasted! If you play this game enough times, you should break even on average (formally, this is a 0 expectancy game), but what may surprise you is that the odds of you having exactly $0 after a million trials is very, very, very small. Much more likely you will be up or down a few hundred than exactly zero. That question was pretty easy–here is a much harder one.
- If we keep a running total of your net P&L on each turn, it seems obvious that it will cross zero sometimes. (Imagine you win $1 on the first turn, then win $1 on the next, then lose on the next 2 and you are back at $0 total. In this case you were positive for 3 turns.) How many turns, in this random, breakeven game, would you expect to be positive or negative in a row? In other words, if we were to graph your running total P&L for a million turns, how many turns in a row would you expect it to be above or below the zero line? 100? 1,000? 10,000? More?
- And a related question: If we play this game for a million turns, do you think your P&L will cross zero many times, or is it more likely to spend a lot of time either positive or negative?
I built a quick computer simulation to give us some idea what might happen in this game. I ran it 5 times for 1,000,000 coin flips each game. I kept track of the number of heads that came up and the maximum number of flips your P&L stayed on one side of the zero line. Last, I graphed your P&L for each of the 5 games. I think the answers may surprise you.
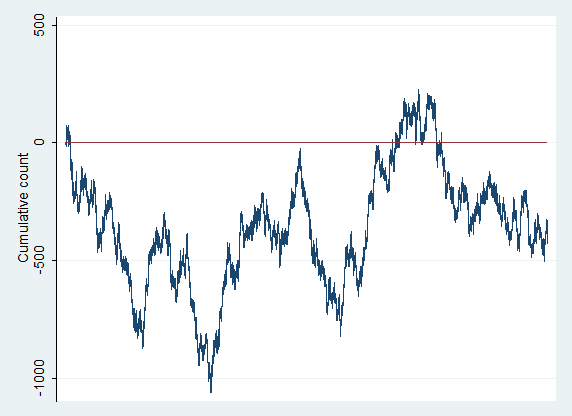
For the five games, you flipped heads 50.03%, 50.01%, 49.99%, 50.05%, and 49.98%. Nothing shocking there–pretty much just confirms that the coin was fair. (As I said before, the chances of flipping exactly 50% heads is exceedingly small.) Here is what the graph of your P&L for the first game of 1,000,000 flips looks like:

P&L record for 1 million coin flips
Wait a minute? Really? Most people expect that the P&L would stick pretty closely to the zero line, but, in reality, excursions from the line are VERY common. Furthermore, once you are far away from zero, it is more likely you will spend more time away from it than go back. In fact, in this test run (which really was the first one I did), there were 814,763 (out of 1 million) consecutive flips on the positive sign of the zero line! Lest you think this run was an aberration, for the other tests, the numbers were 71,903, 646,124, 453,474 and 87,492 consecutive closes above or below zero. What is going on here and why does this seem so strange to us? It turns out there are some important lessons for traders here.
The bottom line is that humans tend to have poor intuition about random events. We underestimate how “streaky” random data is, and so we have a difficult time looking at data and making a judgment about whether it comes from a random process or not. In the graph above, your P&L was above zero for more than 800,000 flips of the coin, and, to a casual visual inspection, the chart appears to be trending. If this was an actual system you were trading, do you think you would have concluded you had some actual edge in the market?
There is another lesson here. Instead of being a graph of your P&L for my silly coin game, imagine that the chart above is a chart of a stock’s daily prices. (In fact, what I have generated is one kind of “random walk” price path, so this is a legitimate way to think about it.) Look at that chart (and the ones I will attach to the end of this post). Do you see trends? Do you see support and resistance? Of course… look how well the “zero line” provided support twice, and the the stock traded away and never looked back. If this is your first time looking at random price paths like this, are you surprised to see these patterns? Remember, these charts really are truly random. Any patterns we see are just due to random chance. There is no actual support and resistance on these charts. Every trend or trading range you see is purely the result of randomness. There is nothing but randomness, but your eye will manufacture patterns in the same way that, presented with random patterns in clouds, you will see faces.
So what is the point here? A reminder to be careful in your thinking. Don’t assume that , when something happens in the market, it “can’t be random.” Random market action can produce patterns that might surprise you. Don’t assume that, when you have a string of good trades, you necessarily have really found a sustainable edge in the market. Many traders find it very uncomfortable and challenging to think about these topics, but I believe they are very important because they drive right to our core beliefs about what makes the market work.
(Take a look at the charts from the other four games. Remember, each of these are 1 million flips of a fair coin, but evaluate them as if they were stock charts. Do you see trends? Trading ranges? Support levels? Hmmm….)


27 Comments on “Exploring Randomness: Thought-Provoking Insights and Reflections”
what an interesting and, honestly quite disturbing post. so strange to see what i consider to be tradeable patterns in these charts.. that obviously are based on absolutely no edge. which brings up the question of.. how would one determine they actually have an edge in the market? perhaps a topic for the next post! lol.
actually.. now that i’m thinking about it.. on the flipside, it seems this suggests that even with little to no edge, one can extract profits from the market with excellent risk and money management.
This is a great post in that it can show the action of a trading system. One way to keep an edge is to identify when it’s not working. A trader could do that by plotting a moving average (ie. 10 trades) with that system they’re using and when it goes below the moving average on their equity curve then they turn the live trading off with that system and then paper/virtual trade it. Then when it is perforing well again, its time to go live. This all requires discipline and the “administrative” skills of a trader. I am sure there are many other ways but this is just a simple example.
Adam, excellent work. Psychologists refer to this cognitive bias that you so nicely illustrated with your research, as ‘subjective validation’, or the personal validation effect’.
Your statement: “Random market action can produce patterns that might surprise you. Don’t assume that, when you have a string of good trades, you necessarily have really found a sustainable edge in the market”, is a very important lesson for traders. But most traders will, unfortunately, not understand it.
A different but related phenomenon is when traders take a statistic and, in their own mind, turn it into a probability. For example, traders will see a back-tested set-up that has a 60% win rate and think that it will work 6 out if the next10 times. There are several reasons why this is erroneous thinking, and I don’t want to list them all here, but two that stand out are: 1) in order for the 60% ‘market history’ to function as a ‘6 out of 10 market future’, it would require that the same exact market participants are present for both the ‘history’ and the ‘future’; and 2) psychological variables will prevent most traders from acting in the exact same way over the 10 occurrences.
Andrew Menaker, PhD
Trading Psychologist
http://twitter.com/PopDocTrader
http://www.andrewmenaker.com
Adam, once again a post of yours for the treasure chest!The first two comments show that it is really hard for most people to grasp the concept. There is no edge in your examples and without it no risk or money mgmt. can help you . Risk and money mgmt. helps you to sustain your edge but it cannot substitute for one.
Your post confirms my view of technical analysis: You should know about it because there are a lot of people watching it (esp. s/r areas) but it is very, very hard to gain any sustaining edge from it. You have to look at the order flow shown in the T&S and Level II. There the big players show their hands (sometimes).Cheers,Markus
This is an experiment I ran a while ago when I first started following the markets and read about the efficient market hypothesis. I too was amazed at how my eyes saw R/S levels and trends.
One fun extension to this project is to try and build a trading system that trades random data. Try making up rules like you would in any other trading system and see if you can “beat” the randomness… Can good money management rules save you from ruin? We know that money management doesn’t help when you play games of chance like roulette where the odds are against you, but what about when they are 50:50.
on a related note:
http://www.youtube.com/watch?v=b_6-iVz1R0o
There was no edge, therefore there is no trend?
Richard Dennis made 100 million bucks trading breakouts and sticking with them until they died.
From all i’ve read about his work, he had no ‘edge’ other than breakouts and money management.
Yeah, I know, it doesn’t work anymore, but what ‘edge’ does work forever?
Adam, if you take all your results and plot them, do you get a normal distribution or the leptokurtosis of real financial data? Apples & oranges.
thanks for the comments and good discussion here guys. this was a background post for my next one which was going to focus on expectancy / statistically evaluating trading results, but maybe i need to do another post before that one. let me think about it… several interesting issues raised in the comments here.
awesome dude
I absolutely agree with your broad theory, but mathematically I believe there is a money management scheme that could be applied to this random walk that would increase the odds that you ended the game in the positive. If, by random chance, you are above the zero line, then you reduce your next bet by some percentage of the original $1. What that does is eliminate the chance that the next flip will take you below the zero line. You could continue to do this by reducing your bet every time a new high is made on your P&L line.
You are right. It doesn’t give you an edge, until you are already profitable, but it exploits the same mechanism that can appear to cause trends in random walks. Once you’ve moved away from a zero line with a series of positive flips, there is no expectation of reversion to the original zero line, because the current zero line actually moves with every flip.
wherever this is going, we all certainly want to read more. one thought though. if we plug on our winrates here, it might give us some more interesting thoughts for whatever you’re going to write about going forward.
http://www.verticalsolutions.com/tools/pl_forecaster_pctwins.html
This is a great post, but please take a look at this book, published many years ago by Benoit Mandlebrot (the promoter of fractals): “The Misbehavior of Markets: A Fractal View of Financial Turbulence”. In the book, he describes almost the same coin flip test, with almost the same results. Here is an image of 1 page: http://screencast.com/t/9XRV24kGEX1 It is a long read, but probably worth it. And it bears the following review from Nassim Nicholas Taleb, author of “the Black Swan”:
“The deepest and most realistic finance book ever published.”
This sums it up entirely.
Jeff, if you have an edge you should increase your betting size commensurate with your growing profits and not reduce it.
That’s some good food for thought. The post does an excellent job of shedding light on the psychological mechanisms that work against the trader on day to day basis. In essence though, looking at the larger picture (1000000 flips), an edge appears to be a figment of our imagination. On a microscopic level though, if we looked at segments of the graphs, or smaller time intervals, would it not be possible to justify the existence of a temporary edge to capitalize on?
It is posts like this that makes the SMB blog such an invaluable part of the trading community. Many, many thanks.
It is posts like this that makes the SMB blog such an invaluable part of the trading community. Many, many thanks.
Yes, if the edge is produced by the trading setups, but in this case the edge is produced by the money management. This is a mathematical edge produced by the reduced bet itself. It’s also not directly applicable to actual trading, and I agree with what you’re saying.
Do SMB traders see patterns or merely react to random events?
Take a look at http://arora.ccs.neu.edu/v4/tool/login.jsp.
Just as another tidbit of knowledge for anyone reading the comments, this idea of simulating stock market prices as the sum of a series of coin flips yields exactly a 1D random walk, and in the limit of t->0, is Brownian motion or more specifically a Wiener process. This is the type of model used to price options in the famous Black-Scholes equation – by measuring the effective volatility and assuming some underlying upward drift, the formula yields an exact price for an option.
One more interesting tidbit is models using the Wiener process tend to underestimate the probabilities of unlikely events. These are the so-called “black swan” events like the crash of 2008 or other market panics. Empirically, people have adapted the use of a type of distribution called the Levy alpha stable distribution, which has fatter tails, and empirically matches stock market returns very well.
love how all these people would trade a random generator
happy to exist in a world where I can snipe idiots for the rest of my life.
If you put an ant under a magnifying glass it does not actually become an elephant.
You’ve done 1,000,000 “trades” and you’re up or down .1%. That is insignificant.
If you buy AAPL at $330 and it goes up $.33 (.1%) I say that is pretty insignificant. If the price scale of your graph goes from $0 to $400 it will be hard to detect any movement. If your price scale goes from $330 to $331, it will look like a really big move, complete with support and resistance, etc. But that illusion of movement is created by the “magnifying glass”, not by any real sense of what is happening.
Jiminy,
Respectfully, I think you’re missing the point on several levels, not the least of which is that this is a 0 mean random walk so you would expect to be up/down very close to 0 at the end of the run.
There is no illusion of movement or magnifying effect here. The concept is applicable to ticks or to months… it is scale invariant… some people talk about the “fractal” nature of markets which also does make sense if you read the Mandelbrot book on markets.
this is completely in line with how I trade. It is said so often:”limit your losses and let your profits run”. Mentally that is a hard game to play, takes practice. But it is as simple as this. If you take 10 long trades (let’s keep it at ten for the example) and you enter a random market at 1000. You know that 5 out of ten you reach 990 first and the other 5 you reach 1010 first. What you need to do is to cut your losses of those five that reach 990 at that level. The once that go to 1010 you let them run and you trail them in a way you are comfortable with. And yes, 2 of those 5 that reach 1010 might end up with a loss after all of let’s say 7 and 3. One of those 5 might result in only a win of 7. One might result in a win of 25… But the last one could be that big winner of 60!
So in the end
Total loss: 60
Total profit: 92
Nett profit: 32
Everybody that works with a fixed stop loss AND take profit is doomed to fail. When long you should always get stopped out because prices are coming down and short vice versa. That way your profit is unlimited, your losses are limited and in case you are up your profits are protected.
Shaka,
Frits Altenburg
Very, very useful vdo! Thanks!