Here is a checklist I use for developing an intra-day trade idea. If the answer to the first two items is YES then I continue down the list to develop a trading thesis. If NO then I don´t trade the stock.
- Identify if it has a strong catalyst–a strong catalyst often leads to heightened volatility (movement) which is necessary for good risk/reward tradess
- Unexpected earnings result
- A large contract
- FDA drug approval
- New product announcement
- Check for “sufficient liquidity”
- This will deend on experience of trader
- Generally, a stock trade 1mln plus shares on average (i go into more detail on this in our free 2hr workshop. https://bit.ly/2w52tQq)
- Examine how investors/traders are positioned on several time frames
- On the daily chart where is the stock trading in relation to its 52wk high and 52wk low.
- In the weeks prior to the catalyst where have most people been buying and selling the stock. This allows me to make an informed judgement as to how motivated they will be to add or take off positions
- Look at trading volume and prices immediately following the catalyst
- Estimate where the stock will trade when the market Opens (this is only possible if the stock has sufficient volume outside of market hours)
- Based on #3 and #4 define multiple support and resistance levels (often these will be *areas* and not simply levels)
- Have a clear plan as to how you will trade the stock in relation to the S/R levels you have identified
- If you have a long bias what price action would you need to see to confirm your bias? To reject your bias?
- If you have a short bias what price action would you need to confirm your bias? To reject your bias?
- If you are *neutral*, neither long or short bias, will you trade between S1 and R1 OR wait for evidence of a larger possible move?
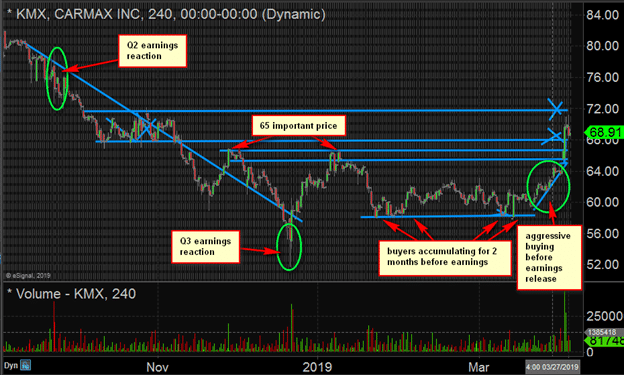
Let’s look at a recent example from our March 29th game plan. KMX reported 6% better than expected earnings.

- Identify if it has a strong catalyst–KMX beat EPS by 6%. As a rule of thumb if a company beats/misses EPS estimates by 5% or greater that is a strong catalyst. What made this particular report even more interesting to me was the EPS beat came despite light revenue. By definition this means the company had strong gross margins. Investors will often over react to strong or weak margins. As traders we love this!
- Check for *sufficient liquidity*–averages over 2mln shares per day. After an earnings release at a minimum we would expect 2-3X average daily volume. This is excellent liquidity for an intra-day setup. The expected volume is also in the *sweet spot* for tape reading where you can spot buyers/sellers on the tape. This can be an extra *check* for trading a larger position.
- Examine how investors/traders are positioned on several time frames–KMX down about 20% from its 2018 high after having bounced from the mid 50s in late December. In the month prior to earnings stock was accumulated in the high 50s. Would these recent buyers be motivated to 10-15% where they had recently bought?
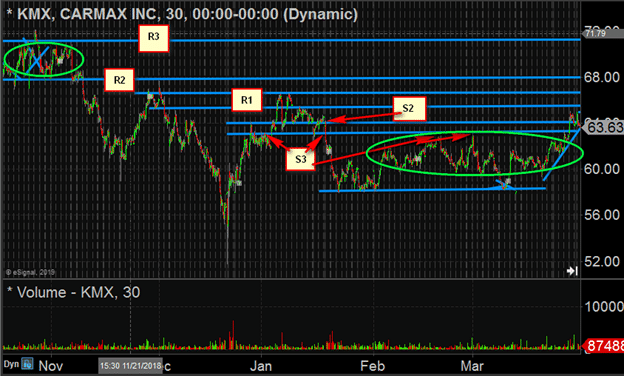
- Estimate where the stock will trade when the market Opens–this was tough as there was little pre-market volume. The stock was trading around its 2019 high in the pre-market so we used that as our first potential resistance. Holding above R1 would give us R2 at the bottom of the October consolidation range. And if R2 lifted there would be significant upside to the top of the October range. Once a stock pushes inside a prior trading range it will often follow through to the other side of the range. (check video from morning meeting below where this is discussed).


Here is a zoomed in look at KMX when it opens. There is a natural tendency when a stock gaps higher to attract some sellers immediately when the market opens. Often stocks that eventually trend higher for the day will have some sort of *drop out* in the first few minutes. The best way to judge whether this is a buying opportunity versus the beginning of a downtrend is the size of the initial down move and how long the stock holds below potential support levels.
In this case you can see after a quick drop out below R1 KMX quickly reversed bouncing about 3X the magnitude of the down move and began to consolidate above R2. At this point the trade is long and you are just trying to get entry prices with the best risk/reward. Any type of sideways movement above R2 is a good entry if it R3 is at least 3X further than away than your potential stop. 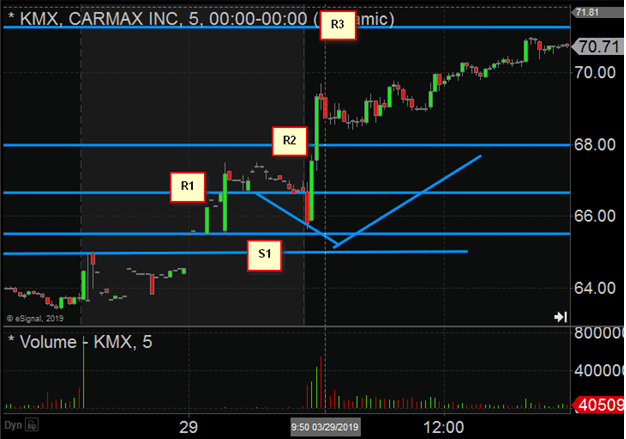
One of the most important aspects of putting together a trade plan is visualizing how the stock may trade once the market opens. If you can see the potential paths a stock may take it will make it easier for you to be aggressive at the right time. And conversely to hold off if the stock is not presenting a favorable setup. So if you choose to adopt part or all of this process and make it your own please don’t skip or minimize this aspect of the process.
Good luck!