Last week, we looked at money flows between different sectors of the market as a gauge of investor psychology and market sentiment. Today I want to look at the relationship between large and small cap stocks, another key internal “indicator” for the stock market.
There are many interesting fundamental arguments for why the performance of large and small cap equities should diverge in different economic environments. Some of these are: access to capital and financing costs, that more analyst attention is usually focused on large caps, and that different players with varying investment goals who tend to focus on specific strata of market caps. This “size effect” is one of the well-established academic anomalies, but there are a number of market microstructure explanations (primarily asynchronous trading, size of bid/ask spreads and liquidity issues) that suggest the size effect may be mostly an illusion. Regardless of how interesting these explanations may be, they are pretty much irrelevant for our day to day trading.
The important element is that either large or small caps usually tend to lead on market swings. If you can identify which one is leading, where the buying or selling pressure is focused, then you can use the breakdown in that relationship as one confirmation of an intermediate term trend change.
As everyone knows, we have been in an unusual market environment where every dip has been bought with confidence. Intraday, every new low has met ready buyers, and on the odd day where we actually managed to close down, the bulls were there on the next open to carry us to new highs—shorts have been punished quickly and efficiently for many weeks. The small cap stocks led the market rather dramatically for the entire 2009 rally, and we saw this effect come back in force at the turn off of the February lows. Intraday, one of the relationships I monitor closely is the relationship between the S&P 500 (a large cap basket) and the Russell 2000 (mid caps). Examining intraday charts from two recent days will show how we saw, in real time, the breakdown in small cap leadership within a few days of the market top. I apologize that these charts are pretty dense and contain a lot of information, but I think they will reward a few minutes’ carefully scrutiny. (I find it much more useful to follow futures than ETF’s intraday, but I am assuming more of our readers have access to ETF’s, so I am illustrating with SPY and IWM here.) Furthermore, these charts are only an illustration. We get a lot of information from reading the tape and monitoring buying and selling pressure on the shortest possible timeframe, which cannot be captured on any chart.
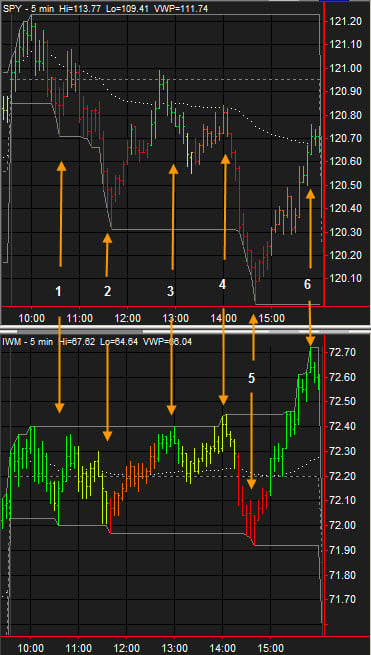
Here is day 1, 21 April 2010. To put the move in context, the market had made a new high on very weak volume and momentum four days ago, sold off pretty hard the day following that high, and then bounced for two days. Going into this trading day, the question on my mind was “could this be the turn into a longer consolidation?” Looking at the SPY/IWM intraday, we saw good evidence that the smaller cap leadership was intact, and the answer to my question was a resounding NO:

1. The S&P makes a good new low, while the R2K only ticks to new lows. Strike 1 for the bears.
2. The S&P absolutely collapses through the day’s low (solid gray line on the chart), while the R2K is not interested in participating at all, and only barely ticks to new lows. Strike 2.
3. Now showing real leadership (after tipping their hand at the day’s lows), the R2K trades to the day’s highs. The S&P, taken alone, still looks very weak as it cannot even hold above VWAP (dotted gray line in the chart), but we knew not to push shorts because the market was not actually weak.
4. R2K shows strength again by ticking to new highs while the SPY cannot even lift VWAP.
5. Is there a chance the bears win here? The market melts to new lows after SPYs hold under VWAP, but the R2K again only barely ticks to new lows. Strike 3 for the bears…
6. … and they’re out. The R2K explodes to close at new highs, leading the market to new highs on the year over the next three days.
Contrast this with what happened a week later, on April 28th. In context, the market had just made another high for the year two days ago, but had failed in what appeared to be a classic failure test at the highs. In my daily advisory letter, I had just issued a short sell recommendation on the US Equity market, and I was very alert for evidence that this call could be wrong. The day before this day, the market sold off very hard, and I was, frankly, expecting the buyers to step in and sweep us up to new highs on the year. However, look at how this day played out:

1. We come in expecting a consolidation day due to the bigger picture context, so we tend to ignore the morning noise. Shortly after 11:00, the S&P 500 makes a new high and the Russell is not even close. This was the first time we had seen this in a long time, and at that point I turned to Gman who sits beside me and said, “that was different. We gotta pay careful attention now.” Remember, the playbook for many, many weeks had been that the Russell was much stronger intraday, and this was the first sign of a breakdown in that relationship. (There was also information and context on the tape that you cannot see on these charts.)
2. After the new high on the S&P, both indexes melt to new lows. Watching the bounce at point #2, the SPY’s easily lift VWAP, while the R2K is unable to do so. Again, this lack of buyer commitment in the mid caps was very different, and was a clear signal that buying pressure was weakening.
3. Now the SPY’s pop to new highs on the day, but the R2K isn’t interested in playing along.
4. At the end of the day, the Russell closes under the day’s open and near the low of the day. This is not how a market should look if there is real demand and buying pressure, and I was reasonably confident that the high put in place on 4/26 would stand for a while. That night I wrote in my market report: “In the short term we can expect more consolidation and would be willing to add to shorts in the 1196 – 1205 range (S&P Cash). In the intermediate term we can expect that this consolidation will resolve downward, probably in a strong momentum move…. do not underestimate the potential weakness on the next leg down. Buying blindly into this could be painful, so it is important to wait for proper spots to add risk.”
Now, a few important points to close. First of all, do not take any of this to indicate that we could have seen or predicted the incredible intraday selloff this past week. That was such an extreme and unusual move that no one could have seen it coming. Secondly, the specifics of this analysis are not important, but the concept is critical. It is very important to watch related markets, to know where the strength is, and to know how to monitor breakdowns in that strength. This concept applies, without any loss of generality, to any set of markets that have a true underlying fundamental relationship. Lastly , there certainly is an element of subjectivity in this type of analysis, but the key element is trying to understand the relative conviction of buyers and sellers in different markets.