Each earnings season I look for discernible intraday patterns to emerge. As earnings season begins in about two weeks I’m already on the lookout. Two stocks reported numbers last week that may have given me a clue as to what to expect in the coming weeks.
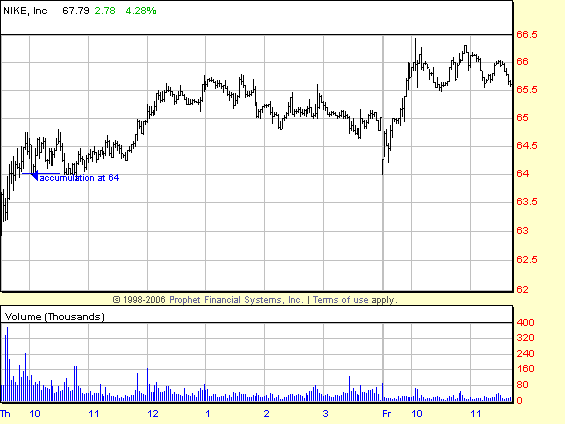
The first stock to report that I traded was Nike. It gapped up several points on Thursday following the release of their numbers. I decided to trade NKE as it provided a lot of opportunity last quarter after disappointing the Street. My initial trade was a fade in front of the $64 level. My thought process was that NKE isn’t a high flyer and that it would meet some resistance the first time it approached this level Thursday morning. The trade worked as it quickly pulled back to $63.50. I covered all but 100 shares of my position so that I would keep an eye on it if it approached the $64 level again or began a reversal to the downside below $63. Over the course of the next 10 minutes it traded above $64. I didn’t make my second trade in the stock until I noticed something very unusual. At 10:03AM NKE pulled back from its high of $64.60 to $64. Sellers began to frantically hit the $64 bid. A series of 1 and 2 thousand share prints at $64 scrolled across my screen. But despite the frantic selling the $64 Bid never dropped. I got long NKE and shared with our desk that I had just observed a buyer potentially beginning to accumulate a large position.
NKE continued to be accumulated at the $64 level later in the morning and would eventually trade as high as $65.80. The following day the futures gapped down and provided another excellent trading opportunity in NKE. It opened right at its $64 support level and closed the day around $68 a share.
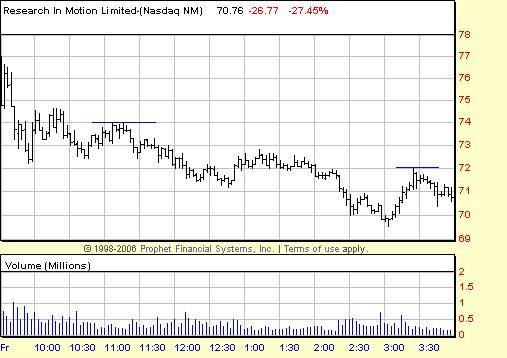
The second stock that I traded after it reported was RIMM. I actually blogged about what might be in store for RIMM last Sunday. RIMM disappointed the Street and gapped down about $20 Friday morning. I established a short position just prior to 9:30AM at $77.90 per share. When it traded below its premarket support level of $76.50 my short bias was confirmed. RIMM closed Friday around $71 a share. Based on what I saw on Friday I’m expecting it to trade down to $65-$68 a share in the next few days. However, if it trades above $74 on heavy volume I will look for a move to the high 70’s.
So what pattern do NKE and RIMM have in common? How can I use this pattern to potentially profit as earnings season begins? The answer is “follow through”. NKE surprised the Street to the upside and closed near its high. RIMM disappointed the Street and closed near its low. Both stocks finished the day with the same direction that they started the day. I will look for this pattern in the coming weeks. I will observe buying and selling patterns in the aftermarket and premarket activity to give me additional information to help support or rebut my thesis.


2 Comments on “Earnings Season Pattern Emerges?”
thank you, this was very helpful.
thank you, this was very helpful.