Each Friday after lunch, Andrew and I do a Q&A webinar for the SMB Community. We call it Trading Conversations. One question we covered in last week’s webinar was about the current state of Crude Oil. I use Market Profile, so I laid out exactly what I was seeing in “Texas Tea” from a Market Profile perspective.
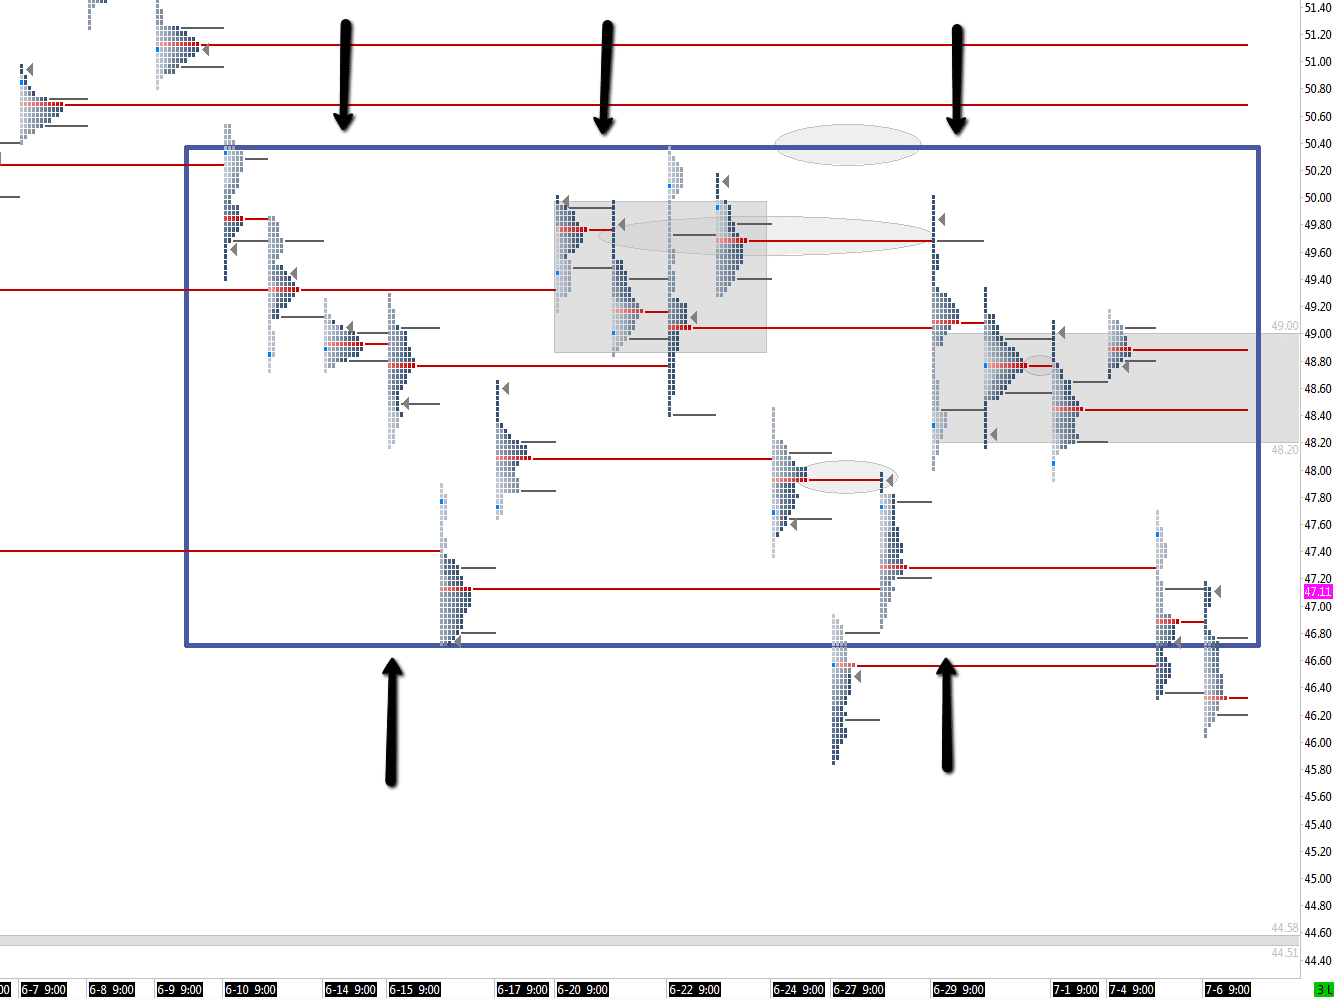
Largest view: 16 days of balance. Price has had resistance from the 50.50 area, and support from the 40.70 area. Price has just bounced around in this general “bracket”. These aren’t extremely precise levels to blindly place trades at, but rather general areas that define out “higher timeframe” market condition of balance. We watch very carefully when price tests these boundaries. See thick navy blue box in the chart below:
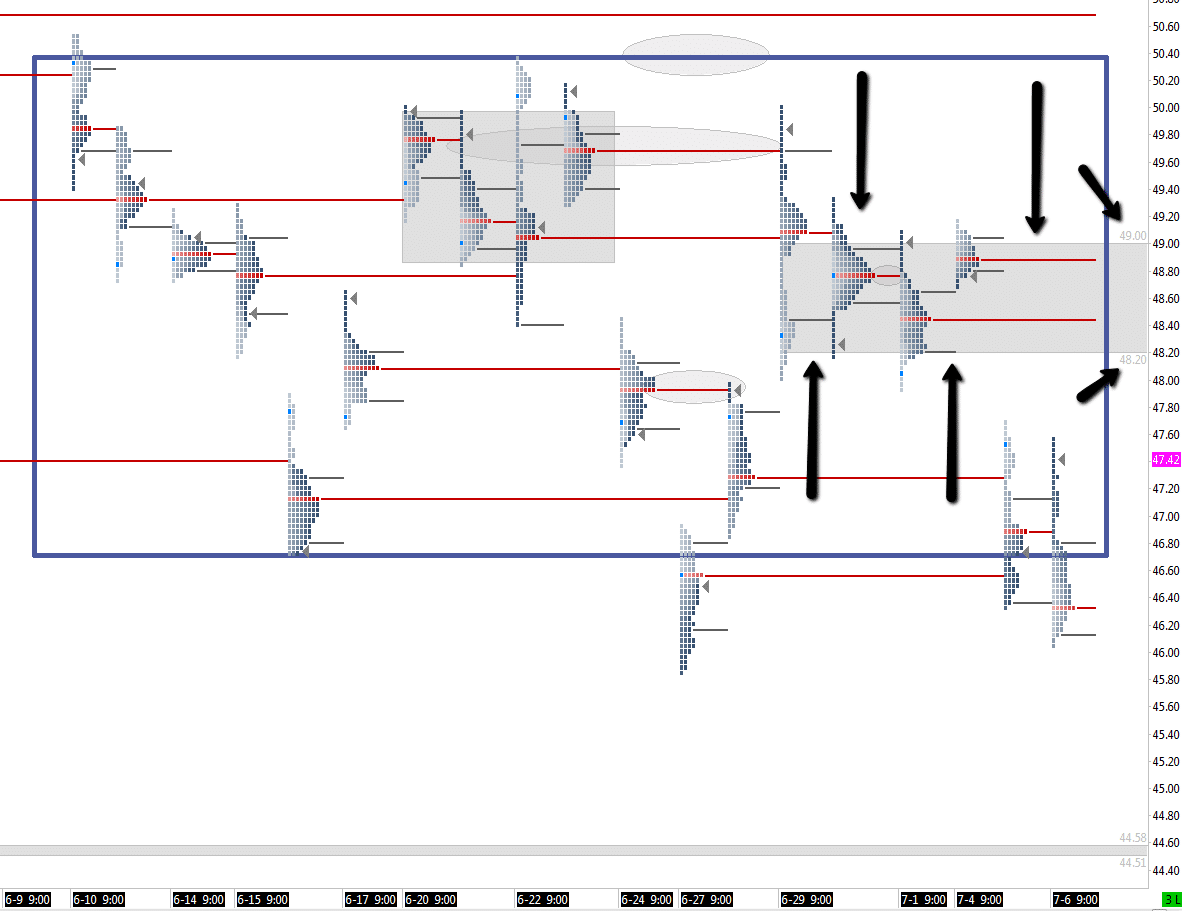
Now with the main market condition identified for our timeframe here, we can look at more granular detail within the bracket. The biggest thing I look for is balance areas. I can spot two very clear ones. One on 6/20 – 6/23, and another couple days balanced 6/29 – 7/1 (as of the time of the analysis on Friday). The purpose if this intermediate term structure within the bracket is to identify trade locations and opportunities within that major 16-day bracket. Our most obvious, recent reference is the multi-day balance from 48.20 to 49.00 shown below with arrows:
So we have our main bracket, and now we have a recent balance area to watch. Let’s talk about what has happened since that analysis on Friday 7/1/2016.
Obviously 7/4 was a holiday and had limited trading. We just consolidated in the recent multi-day balance zone. A real trading day on 7/5 has us open in a breakout below the balance low of 48.20. What does the market do? Goes right down and tests that major bracket low to find buyers. Like clockwork. Let’s continue.
Today, 7/6, we opened up below yesterday’s range as well as below the bracket – look out! Will we sell off creating an entire new long term market condition? Will we fail again at the bracket lows and revert back into the bracket? We have to now watch shorter-term auctions and charts to determine what is happening.
Buyers stepped in right off the open, and we ran up to exactly the bracket low at 46.70 where sellers stepped in and pushed us to new lows of day. At that point, sellers were exhausted and we barely put in a new LOD by a few ticks. Buyers stepped in aggressively from that point, and we’ve been following through all day. See below for the 15min chart on the left beside our Market Profile chart on the right:
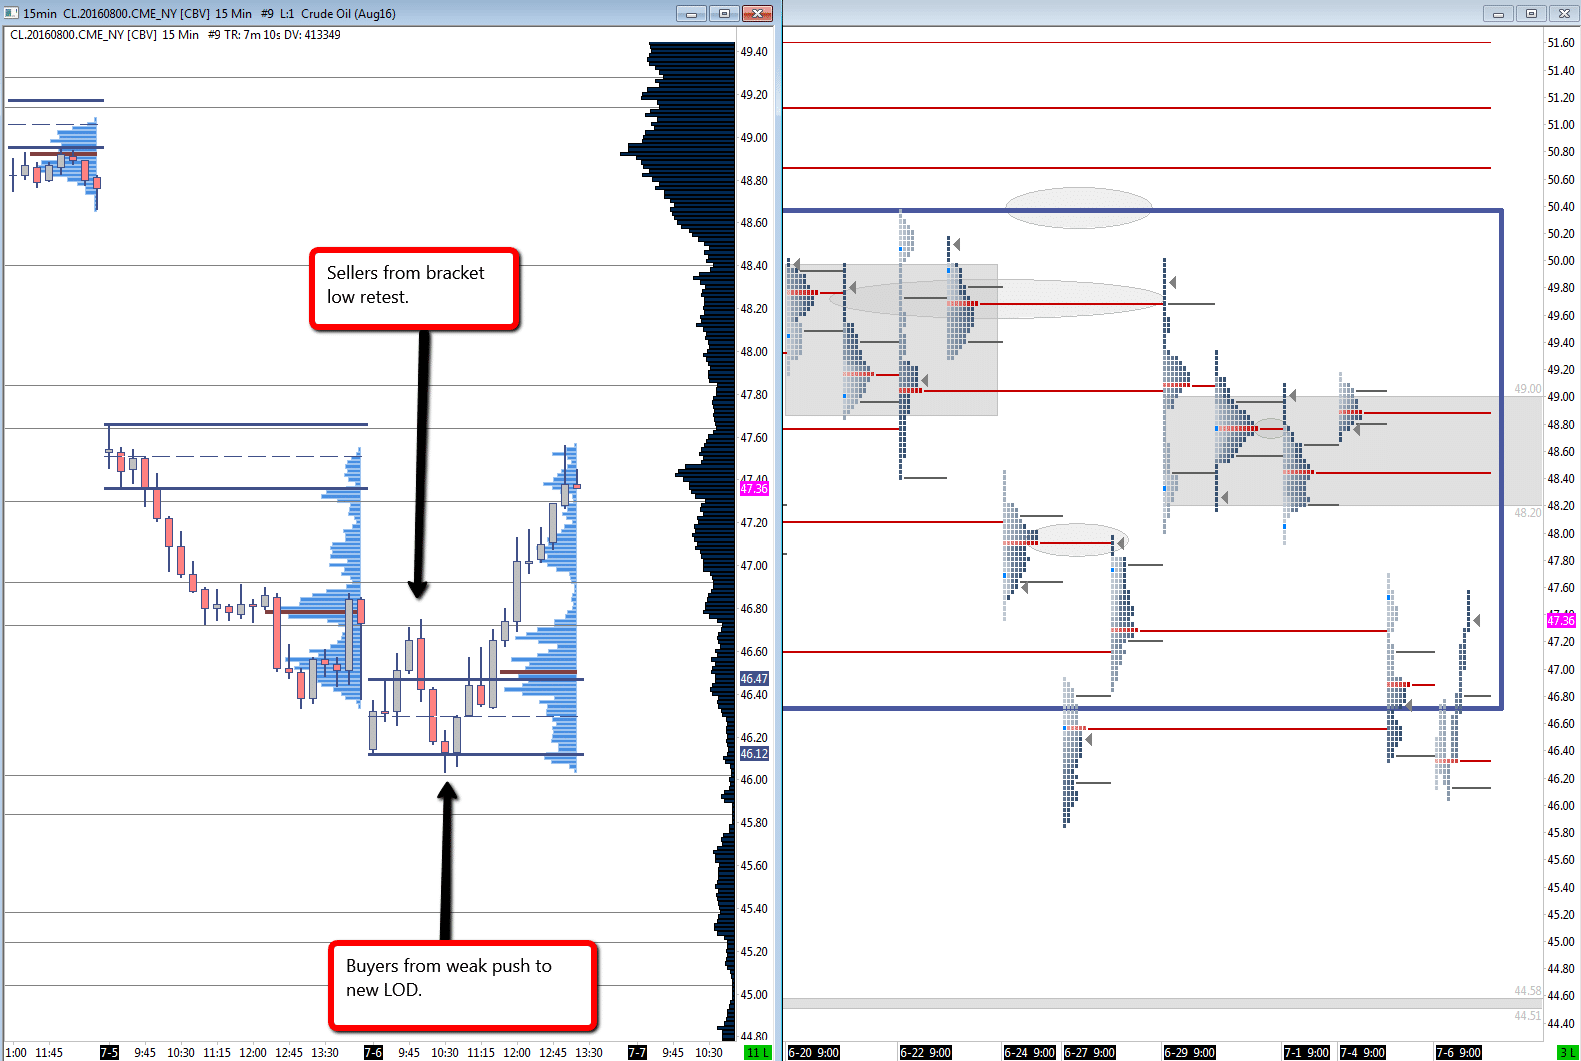
I almost always prefer trading breakout failures. They happen more frequently, the risk:reward is very favorable, and I know exactly what participants are on the other side of my trade – trapped in losing positions!
Trade Smart,
-Merritt
*Merritt Black is currently long August WTI Crude futures.