
“You are only as good as the stocks you trade.”
Mike Bellafiore, One Good Trade
Do you find yourself searching for the right stocks to day trade, only to end up with disappointing results again and again?
As Mike Bellafiore preaches to us at SMB Capital, “You are only as good as the stocks you trade.” You can be the best trader in the world, but you will lose money if you pick the wrong stock(s). Conversely, if you are an adequate trader and choose an outstanding stock to trade, you can profit handsomely.
To be a consistently profitable trader, you have to pick the right stocks to trade. There, I said it.
But what is the right stock? How do you determine which stocks are the best ones to trade?
The answer may bring you millions of dollars in trading profits.
But the good news is that it’s a question that we can help you answer since here at SMB Capital, we have a trading floor of over 50 professional traders. I am one of them.
We’re located in the heart of New York City and are one of the world’s longest-standing and most successful proprietary trading firms; proud to have developed numerous 7-figure and even 8-figure per year day traders.
I’ve been a professional proprietary trader for SMB for years, and in this article, I will share what I believe to be the top 15 day trading stocks (so far) for 2023.
But even more… I will give you the blueprint (Stocks In Play) to find more stocks like this for your trading account.
And even more…I will provide examples of trades you could have made in these stocks.
Imagine having a head start, as if someone has already done most of the work of finding an edge for you.
With this blueprint for finding the best stocks to trade and a comprehensive list of carefully selected stocks (and examples of day trades within them), you can tap into the potential of these market gems, increase your chances of success, and find other stocks just like them!
In this article, traders will takeaway:
- The blueprint to find the best stocks to trade (Stocks In Play)
- Examples of these best stocks with the top 15 day trading stocks of the year
- Bonus- examples of trades you could have made in these top 15 day trading stocks of the year
Get ready to navigate the complexities of day trading and stock selection with confidence.
Understanding Good Stocks To Day Trade
Do you ever feel like you’re trading the wrong stocks?
And if you were in better stocks you would make much more money trading?
Well, you’re right. You need to be in the right stocks; being in them makes all the difference.
The best stocks to trade are what we call Stocks In Play.
Here is how we define a Stock In Play:
- Catalyst- News or Technical or Price
- Catalyst 8 (or better) out of 10
- Liquidity
- Range
- RVOL >3
Let’s explain what we mean by each so you know exactly what to look for as a day trader.
Find a Catalyst (News or Technical or Price)
Stocks In Play are stocks with a catalyst. A catalyst behind the stock will cause many market participants to buy it. And not only buy the stock but buy the stock today.
Think about who moves stocks. The traders who move stocks are those with big money- Investment Banks, Hedge Funds, Asset Management Companies, Sovereign Wealth Funds, Pension Funds, and Private Equity Firms. Think about these big money traders sitting around their trading stations, waiting to put their millions to work. What are they going to be interested in buying?
These big money trades want a catalyst to put serious money to work. They want a good reason to put their vast sums behind a trading idea for their firm and clients. They need to perform. They need to make money on their trades. They must also explain to their clients why they put big money into a stock. A positive news catalyst is something their clients will easily understand and accept.
Read The Only Day Trading Guide a Beginner Will Ever Need (The Basics from A to Z).
So what is a catalyst for these big money traders?
A catalyst is either a news, technical, or price catalyst. A catalyst can either be positive or negative.
A News Catalyst
The top positive news catalysts are
- An unusually good earnings report,
- Better than expected guidance reported,
- A new product announced,
- a Move into a hot new sector,
- Collaboration or partnership with an established company
- Favorable government regulatory announcement
- New large contract for the company
- Cost cuts
- Analyst Upgrades
- Macroeconomic news
- Management changes
- Dividend Announcements
As mentioned, an example of a stock with a news catalyst can be a stock that has recently released its Earnings Report. It is best to find stocks with unusually good or bad news that was unexpected by most market participants. Again think of that big money trader seeking to put millions or hundreds of millions to work. What would get them interested in buying a stock?
Unusually good and unexpected news would get them interested.
A typical example of a news catalyst worth trading would be company XYZ just releasing their Earnings Report, and it is much better than expected. With this positive news catalyst, big-money traders will want to jump in to take a position or add to their existing position. We will want to trade this stock as a result along with them.
Big money traders can drive the stock to much higher prices with a positive news catalyst. Big money traders leave footprints as to their intentions. As day traders, we can detect that they are buying and buying big. We use our Tape Reading skills to see this.
Tape Reading is a study of the order flow of a stock. When traders learn Tape Reading, they can examine the buying and selling of a stock and find areas where it is more likely to go up or down. This is a skill they learn like a basketball player learns ball handling. Can you be a solid basketball player without learning how to dribble?
With this essential skill for day trading, traders can position themselves to find excellent risk/reward trades at prices to help grow their trading account.
For more on Tape Reading, see How to Use Tape Reading to Make Quick Profitable Trades (for Scalping).
Spotting a news catalyst is a very effective way to find a Stock In Play. Consider searching for them in your trading.
A Technical Analysis Catalyst
Having said that, a news catalyst is not the only kind of catalyst that will catch our attention. It is not the only kind of catalyst that helps us find a Stock In Play.
What else can?
A stock that has a technical analysis catalyst.
A stock with a technical analysis catalyst can be an outstanding stock to trade. A technical catalyst is one where market participants are looking for a stock to clear a specific price and hasn’t for a significant time. And then the stock finally does.
Market participants will want to buy this stock when it does. This can make for a powerful technical analysis catalyst to trade a stock.
Popular technical catalysts can be triggered with
- Breakouts,
- Moving Averages,
- Relative Strength Index (RSI),
- MACD Crossover,
- Bollinger Bands,
- Candlestick patterns,
- Trendlines,
- Fibonacci Retracements,
- Volume
Let’s discuss an example of a technical catalyst, a Breakout Trade, to give you more insight.
A breakout trade involves taking a position in a security when its price crosses a certain level of resistance or support, typically with high volume. The idea is that once the technical level is broken, the momentum will continue in the breakout’s direction.
Here’s an example:
Let’s say a technology stock, let’s call it TechCo, has been trading in a range between $50 (support) and $55 (resistance) for several weeks. You notice the price is fluctuating between these levels, but it has yet to be able to break out of this range.
Then the stock price begins to rise and breaks the resistance level at $55 AND AND AND on heavy volume.
You have been waiting and waiting and waiting patiently for this technical resistance level of 55 to be broken. It finally has.
At this point, you decide to make a breakout trade. You buy the stock at $55.06, believing that the breakout through resistance combined with heavy volume will result in continued upward momentum.
After the breakout, the stock continues to rise, eventually hitting $60. At this point, you decide to sell and lock in your profit. This results in a gain of nearly $4 per share.
This is a simplified example of a breakout trade, and actual trading scenarios may be more complex. For instance, you’ll need to consider transaction costs, your overall portfolio strategy, and how much of your portfolio you’re willing to risk on a single trade. Breakouts do not always continue in the expected direction and can sometimes be “false breakouts”, so it’s essential to manage risk carefully and consider using stop-loss orders to limit potential losses.
To learn more about Breakout Trades, visit our SMB Capital YouTube channel and watch The Flag Breakout Trade.
A news catalyst can be a catalyst that catches our attention. AND AND AND a technical analysis catalyst like the Breakout Trade above can grab our attention as a stock to trade.
Price Catalyst: Stocks +/- 3 percent in the Premarket (with volume)
Price can be a catalyst as well.
Stocks gapping up or down 3 percent in the premarket with volume get our attention. This means it is 3 percent higher or lower than its previous closing price. If a stock reacts like this in the premarket, it most likely has a catalyst behind it.
Often, a stock with a news catalyst will gap up or down 3 percent with volume, but sometimes stocks gap like this without a catalyst. Price alone can be a catalyst for day traders.
For a stock to land on our watchlist it also needs volume when gapping up or down 3 percent. The volume required is at least 10 percent of its ADV (average daily volume). Corresponding volume with the gap confirms that there is a catalyst behind the name for this trading session. If a stock is gapping up or down and is not complemented with volume, then we pass on the idea.
Stocks In Play offer us the most trading opportunities as day traders. Stocks In Play often offer us the best trading opportunities as day traders. You can find them daily, in every different kind of market, offering opportunities daily.
Score the Catalyst
After we find a stock with a catalyst, news and/or technical, we grade it. We grade the catalyst on a scale of 1-10. A stock must have a catalyst of 8 or better to be considered In Play.
We determine whether the catalyst is worthy of us trading the stock. We want to save our capital for the best day trading opportunities.
Here is a cheat sheet to help decide whether we trade the stock…
10- We are trading the stock and probably with increased size.
9- We are trading the stock.
8- We are trading the stock but will want to confirm with the price action.
7- We need a terrific setup and price confirmation to trade the stock.
6- Pass
5- Hard pass
4- No thank you.
3- Not interested
2- Move on buddy
1- Never
In our examples of the 15 best day trading stocks, we will score each of the catalysts for you. This will give you an idea of what is necessary for a stock to score 8 or better out of 10.
Also, for more on scoring your stock picks see 10 Reasons We Score Our Stock Picks.
Get in the habit of scoring each catalyst.
Only Trade a Stock with Good Liquidity
So you have identified a Stock In Play. You have identified a catalyst that should make this stock catch the attention of big money traders and thus be In Play. Are you done? Do you just start trading this stock?
No! No! No!
We need more information.
We have identified a stock we will probably trade when the market opens. But we need to check a few more things.
Below is an example of information we check next to determine whether we will trade the stock. This illustration below is from an SMB Trader outlining a recent trade and sharing the information he checked before deciding to trade a stock. We call this information Intraday Fundamentals.
Intraday Fundamentals is the information we need to research next. We check this information as well before deciding to trade a stock.
Let’s discuss what information we need to check with you so you can make the best decisions in choosing a stock.
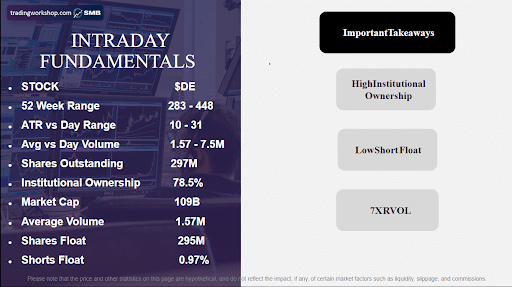
When picking the right stock to trade we want to ensure it has the right characteristics. As mentioned, we check a stock’s Intraday Fundamentals to do so.
Not only do we want a catalyst for the stock but it also needs other characteristics. Without these other characteristics, the stock may not be right for us to profit as a day trader.
One of those characteristics is… good liquidity. Liquidity is the ease with which we can enter and exit a stock. Liquidity allows you the ability to get the amount of stock you want and at the price you want for the stock.
For example, when you go to buy a stock at $30 you want to actually be able to buy the stock at or very near $30. You do not want to end up buying the stock at $30.50. This is too far away from where you wanted to buy the stock. When you go to sell the stock at $30 you want to be able to sell it at or very near $30. You do not want to sell the stock at $29. This is far from where you wanted to sell the stock.
Let’s say you want to buy 1000 shares of XYZ at $30. With good liquidity, you buy 1000 shares of the stock at 30.01. You set a stop loss of 29.49. You wish to sell the stock at 33 and can do so as the stock has good liquidity. So basically you got the stock 1 penny above what you wanted to pay and exactly the price you wanted to sell.
1 penny of 1000 shares costs you $10. So the stock cost you $10 more than you optimally wanted to pay. This is an example of a stock offering excellent liquidity.
Now let’s compare this to a trade that offers poor liquidity. You seek to enter and get filled at 30.26 for 1000 shares. You set a stop loss for 29.49. The trade doesn’t work and you seek to exit near 29.49 but exit at 29.14 for 1000 shares. This trade cost you $260 more than you wanted to enter and $350 more than you wanted to exit. Yikes!
You lost on the trade but you lost much more than you had expected. This is an example of a stock with poor liquidity. This is too expensive for us to trade. This will not allow us to make money consistently in stocks. It is fine to be wrong and lose on trades. But we can’t lose way more than we had intended. We cannot control our risk if we cannot get in and out near where we want.
For those interested in learning more about trading read Stock Trading: The Definitive Guild for Beginners.
And there is more to good liquidity than the entry and exit price…
Further when you go to buy 1000 shares at $30 you actually want to get 1000 shares. You do not want to end up with 10. A stock with good liquidity allows you to get the number of shares you want as well.
We need to introduce a vital trading principle to you that illustrates why the liquidity of a stock is essential.
Good day trading requires the ability to make excellent risk/reward trades. A good risk/reward trade allows you to risk $100 to make $500.
You have to be able to control your risk to make good day trades. If you think you are risking $100 you cannot lose $500 in the trade. When a stock has good liquidity you can control your risk. You can exit losing what you intended to lose on a failed trade.
What good is it to trade a stock with a catalyst if you cannot get the size and price you want? Without good liquidity, a stock is not worth trading.
Another important characteristic of a stock related to its liquidity is the right amount of volume. If a stock has too little volume then we pass on the stock. If the stock does not trade more than 1 million shares on the day, we will not trade it. Usually checking a stock’s average daily volume (ADV) gives a quick guide on whether it will have enough volume. An independent trader can easily find a stock’s ADV by checking for it on a public website such as Yahoo Finance.
Why would we pass on a stock because it trades too little volume?
Because if the volume is too low it is too dangerous for us to trade. It potentially places us in a position where we cannot control our risk. We may lose way more in the stock than we want.
When the volume is too low in a stock it lacks liquidity. When volume is too low it may be too hard for us to exit when we are wrong. Thus we may lose more than we wished on a losing trade. Perhaps we were fine losing $100 if our trade failed but we couldn’t afford to lose $1000 in the same trade.
There is other information we must gather before we trade a stock to ascertain whether the liquidity in the stock is likely to be good. We will check where the stock is trading for its 52-week range. If the stock has broken above its 52-week range it may move more violently to the upside and offer us worse liquidity. If a stock is in the middle of the range it is more likely to make more measured moves and offer us better liquidity.
We check the shares available to trade, Shares Float, to gauge the stock’s liquidity as well. If the stock has many shares available to trade then the stock is more likely to offer us good liquidity. If there are very few shares available to trade, sometimes called a low float stock, then we are more careful in trading the stock as we expect less liquidity.
We check the short interest in the stock to determine the stock’s liquidity. If the short interest is above 30 percent, we carefully trade the stock as we expect less liquidity. If the short interest is less than 5 percent, then we expect good liquidity. Again we can easily check this by visiting Yahoo Finance.
We check the ATR, the Average True Range, of a stock to determine its liquidity. The ATR measures how much the stock moves on average during a trading session. If a stock has a very high ATR then we are careful in trading the stock as we expect less liquidity. If the ATR is low then we expect good liquidity.
The point in checking the Intraday Fundamentals of a stock, this specific information about a stock, is to check whether it will offer good liquidity. Remember we need good liquidity to make solid trades.
A good trade idea without good liquidity is not a good trading idea at all. We need a good catalyst and a stock with good liquidity to find a good trading opportunity.
Range: Trade a stock that will move
We must find a stock that will move. A stock that will move away from price. A stock that will move away from the price you entered a position.
If a stock doesn’t move then we cannot make real money as traders.
One often used measure of how much a stock will move is ATR (average true range). ATR is a technical analysis indicator that measures the volatility of a stock. For our purposes, this is how much the stock will move on average during a trading session.
We stick with stocks that have an ATR of at least 1. That means it will move an average of $1 during the trading session.
And then we look for stocks with a catalyst likely to cause the stock to move at least 2 ATRs during a trading session. So we want a stock that will move at least 2 points intraday.
If a stock meets this criteria then it has the range we are seeking for us to trade it.
RVOL: How you know you have found a Stock In Play
You find a stock with a catalyst. Check.
You check the Intraday Fundamentals and it meets the criteria to trade. Check.
You enter the trade.
But you wonder: how do I know I have chosen a Stock In Play? Is there anything I can check to make sure?
Yes!
A quick note on how to confirm that you are in a Stock In Play. You can check to see if you have chosen wisely for the stock you are trading. For now, you can check if big money traders view the catalyst you have spotted as significant. How you can check to see if this stock is worth trading.
The best and easiest way to confirm that a stock is In Play is by looking at Relative Volume (RVOL). RVOL measures the increased volume that a stock is doing on a given day.
We look for stocks that have an RVOL >3.
This means that the stock is doing more than 3x of the average volume on this given day at the given time on the average day. Increased volume means most market participants are more interested in this stock on this day.
This allows stocks to move more during this trading session, which gives us more opportunities to profit and a better risk/reward on our trades if we know what we are doing.
When day trading, finding the best stocks to trade is essential. Now you have a blueprint to choose the best stocks to trade.
How To Choose Stocks to Day Trade
What tools do day traders use to find Stocks In Play?
Day traders use news services, filters or scanners, market research, and technical indicators to identify the top day trading stocks to trade. Let us provide you with some help in obtaining these services to help you with your stock selection.
The top news services day traders use are
- TradeTheNews
- Briefing.com
- Bloomberg Terminal
- Benzinga Pro
- Yahoo Finance
- CNBC
- MarketWatch
- Finviz
- Reuters Eikon
We primarily use TradeTheNews on our trading desk to prepare for the open. Many traders have access to a Bloomberg Terminal for news.
Traders also use technology to alert them to the best stocks to trade. The SMB Scanner helps traders spot the stocks In Play, by populating them before and during the trading session. This is a terrific tool to help traders find the best trading stocks.
Traders also build custom filters to alert them to the best stocks to trade.
What are trading alerts?
A trading alert is as it sounds. It alerts you when a stock hits a certain price that you have set. You need the functionality to set alerts on your trading platform as a day trader. Most online trading platforms will offer the ability for you to set alerts.
For advanced day trading you may want to set custom parameters for when you want to be alerted to a stock. For example, perhaps you want to see all stocks that hit an intraday high, after 11 AM, that also have an RVOL greater than 3. You can set alerts for this.
Many trading platforms have this built into their platforms. However, some advanced day traders seek a more sophisticated alerting solution, where custom filters can be built. Solutions for this may include: Trade Ideas, TradeStation, and Bloomberg.
Traders also use research from analysts to help them find the best stocks to trade. A favorite market report our traders use daily is Vital Knowledge which provides comprehensive insights into market trends.
Traders utilize specialized tools like gap scanners, news services, and market reports to identify top day trading stocks systematically. Gap scanners like the SMB scanner highlight stocks with significant price gaps, providing potential opportunities.
News services such as Trade the News offers real-time updates for swift reactions to market-moving events. Market reports like Vital Knowledge provide comprehensive insights into market trends. Combining these tools helps traders make informed decisions and find stocks with high day trading potential.
Day traders also use technical indicators to help them spot the best stocks to trade. Examples of the top technical indicators are:
- Moving Averages (MA)
- Relative Strength Index (RSI)
- Moving Average Convergence Divergence (MACD)
- Bollinger Bands
- Stochastic Oscillator
- Fibonacci Retracement
- Volume
- Average True Range (ATR)
Monitoring news and market developments is vital for stock selection as they impact prices. Staying informed allows traders to anticipate volatility, identify opportunities, and capitalize on price fluctuations in day trading.
By the way, if you’re really interested in taking your day trading to the next level, we’re currently running a free online training where you’ll discover:
- The simple high probability day trading strategy that we teach all new traders on our desk (this alone could make you a profitable day trader)
- One of our firm’s most profitable and consistent proprietary trade setups (you won’t see this anywhere else)
- The unique strategy that turned one of our traders into a 7-figure elite trader (which is surprisingly easy to learn and execute)
- How to get funded with large risk capital and trade our money with ZERO risk to you (all from your own home)
Reserve your free spot now. (If you’re a complete beginner, make sure to read this article before attending, so you’re completely up to speed and can quickly and efficiently learn the strategies we teach).
Now let’s share the best stocks to trade in 2023. As a bonus, we include a trade you could have made with this Stock In Play.
Top 15 Day Trading Stocks for 2023
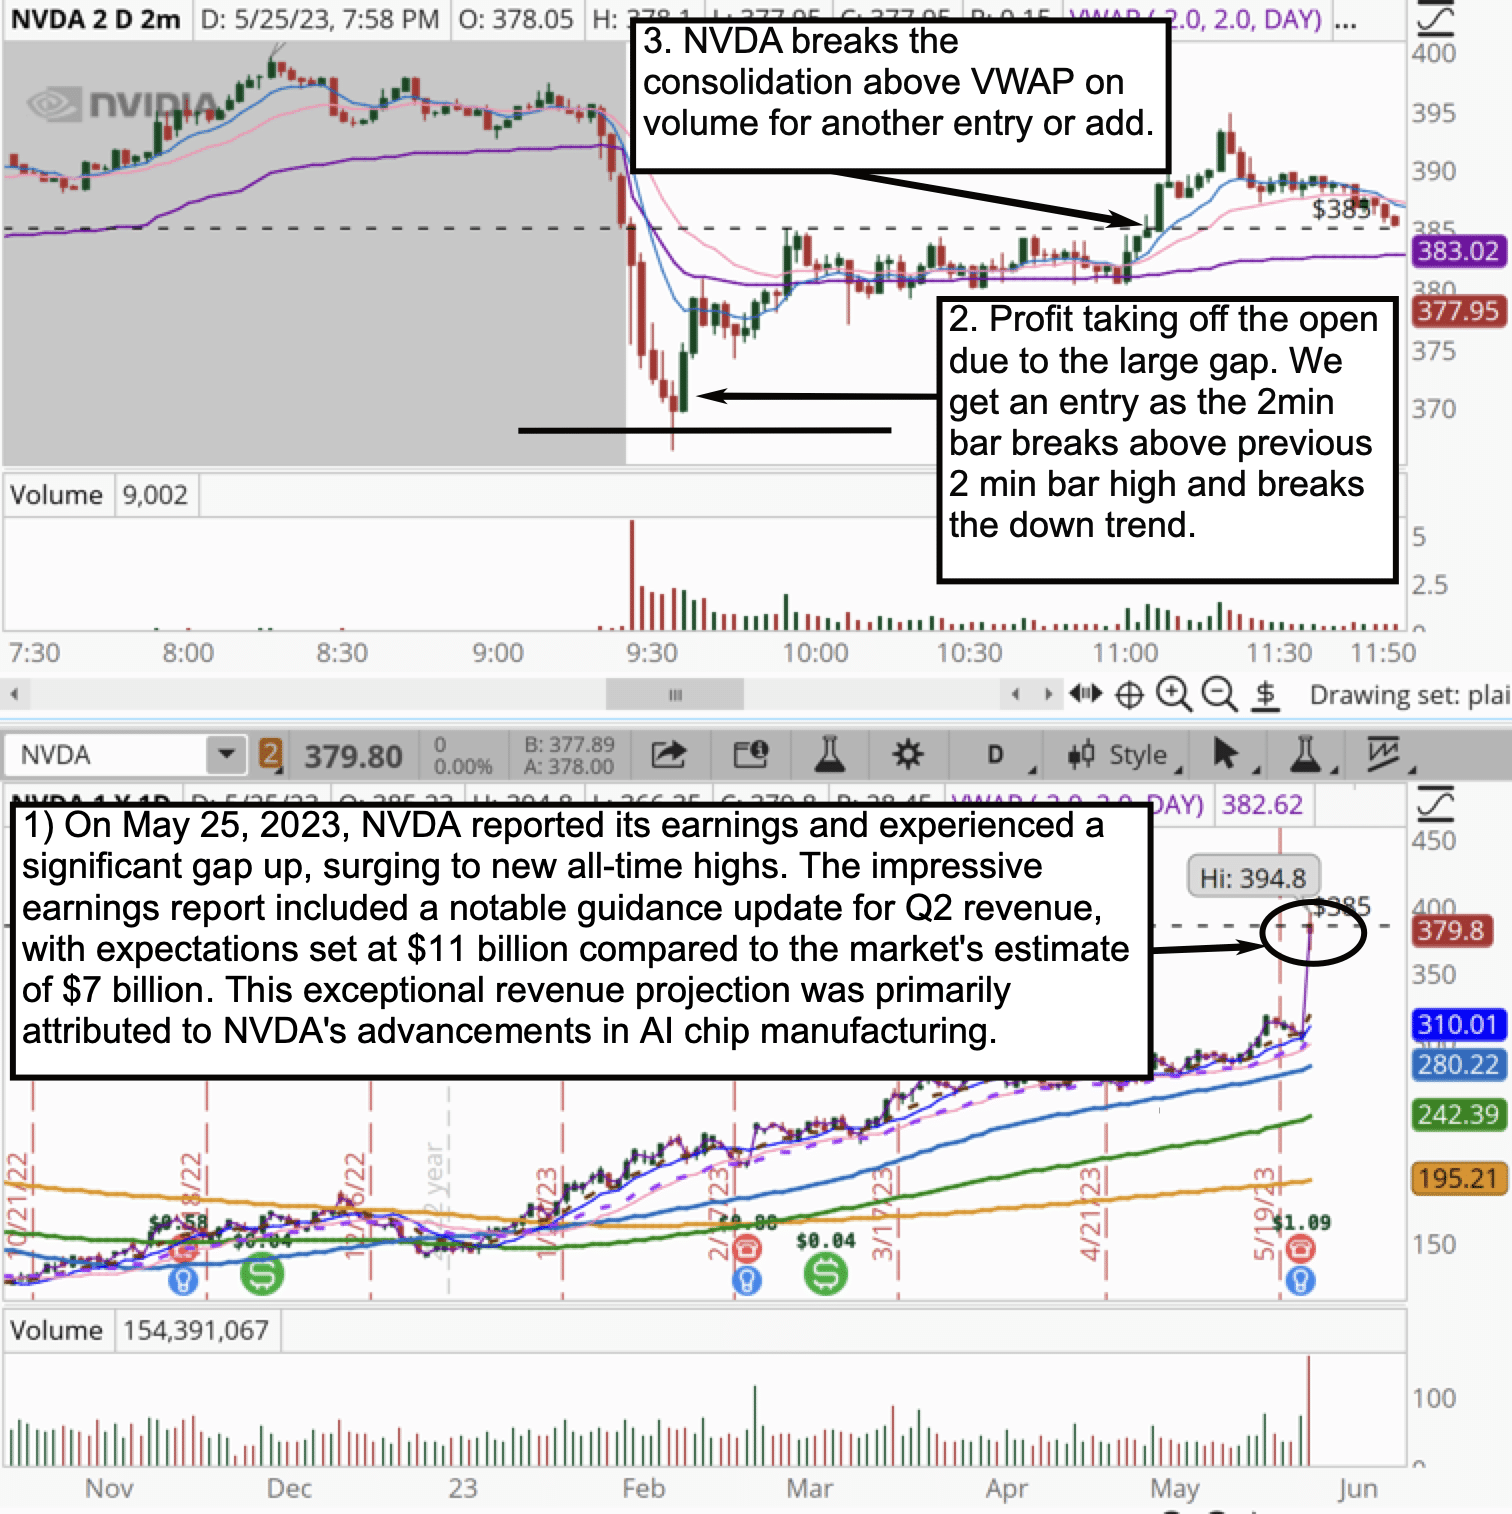
#1. $NVDA
*Please note that the prices and other statistics on this page are hypothetical, and do not reflect the impact, if any, of certain market factors such as liquidity, slippage and commissions.
NVDA is an example of a news catalyst. One of the best news catalysts we saw in 2023.
We score this news catalyst 9/10.
We found NVDA such an appealing news catalyst because it unexpectedly raised guidance significantly and is the key supplier to a sector that is growing massively. It is in what we call a hot sector.
When a sector is growing massively and a stock is in that sector big money traders become very interested. Big money traders look to put significant money into this sector and the stocks in them.
Specifically, Nvidia is well-positioned to benefit from the growth of artificial intelligence (AI). The company’s GPUs are used in a wide range of AI applications, including:
- Natural language processing (NLP): Nvidia’s GPUs are used to train and deploy NLP models, which are used to understand and generate human language.
- Computer vision (CV): Nvidia’s GPUs are used to train and deploy CV models, which are used to understand and interpret images and videos.
- Machine learning (ML): Nvidia’s GPUs are used to train and deploy ML models, which are used to make predictions and decisions based on data.
Okay, we know that NVDA is a Stock In Play. We want to trade it.
We checked and it also has the liquidity we want in a stock.
It meets our range criteria for a Stock In Play.
RVOL was greater than 3 at the time of the trade.
Now the question becomes what is the trade? As a bonus for you, let us tee up a trade that you could have made.
On the chart, point #2 highlights an interesting aspect: profit taking off the open. In certain cases, especially with significant gaps, institutional players (often referred to as big money traders) tend to capitalize on the news and lock in some of their gains. The reason behind this behavior is the presence of ample liquidity that allows them to do so without causing a major impact on the stock’s price.
This scenario presents an opportunity for day traders like us.
Our strategy involves patiently waiting for the conclusion of profit taking, which we can identify as a 2-minute break in the trend as indicated in the chart provided. Once that trend is broken, we can enter and ride the wave up.
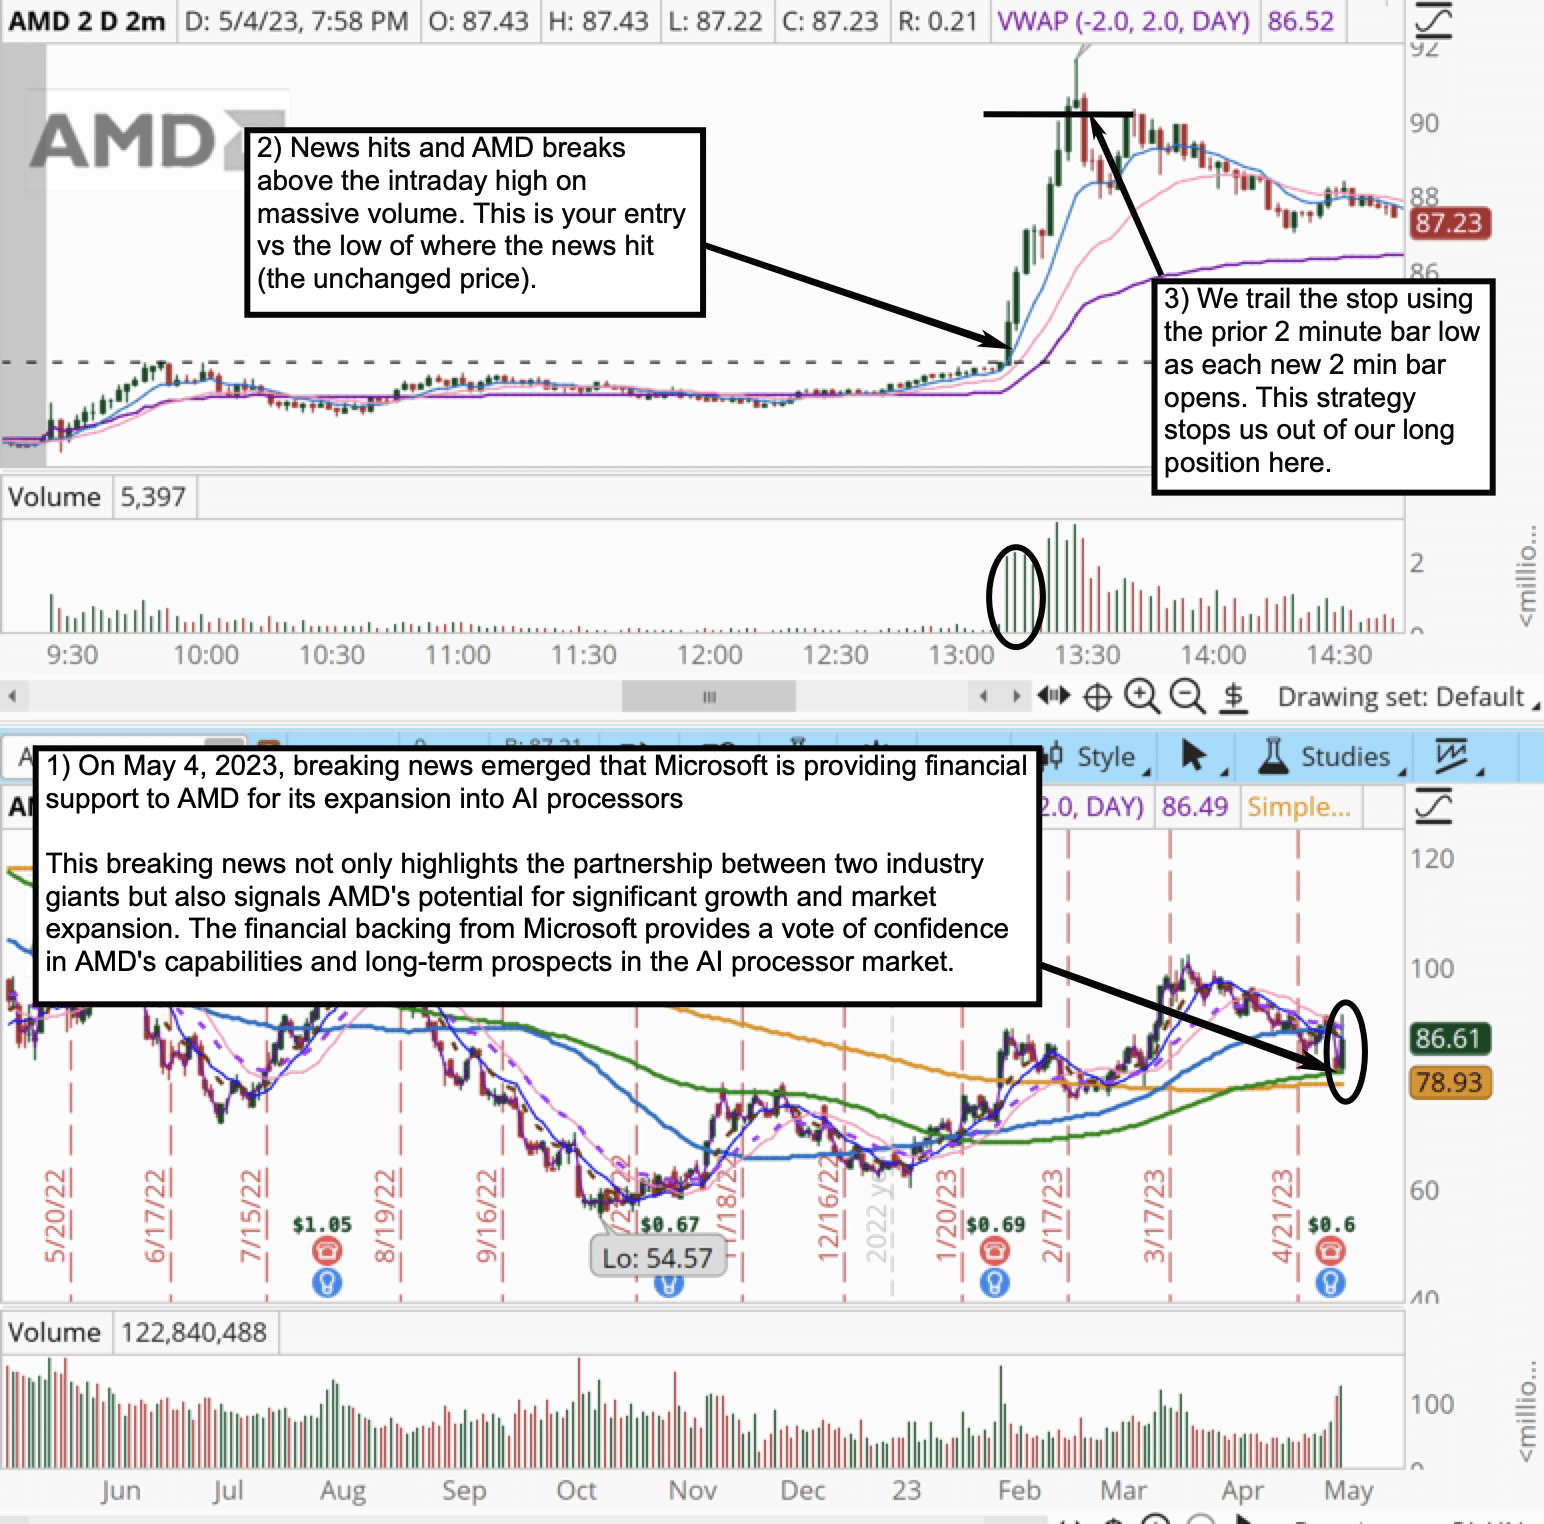
2 $AMD
*Please note that the prices and other statistics on this page are hypothetical, and do not reflect the impact, if any, of certain market factors such as liquidity, slippage and commissions.
AMD is an example of a news catalyst.
We score this news catalyst as 9/10.
Let’s share one of the most remarkable breaking news catalysts of 2023.
Among the most remarkable breaking news catalysts witnessed in 2023 was the midday announcement of Microsoft’s financial backing of AMD’s foray into AI (artificial intelligence) processors. Considering the heightened interest surrounding AI this year and Microsoft’s prominent position in the AI revolution, this news presented an amazing trading opportunity.
There are several reasons why we anticipate AMD to continue offering solid trading opportunities:
1. Strategic Positioning: AMD is well-positioned to capitalize on the growth of the semiconductor market.
2. Competitive Advantages: Boasting a robust product portfolio, innovative technology, and global reach, AMD holds several competitive advantages.
3. Expansion and Investment: AMD is actively expanding its product portfolio, investing in new technologies such as AI chips, and broadening its global reach.
It is a liquid stock.
It meets our range criteria for a Stock In Play.
RVOL was greater than 3 at the time of the trade.
I will offer you a bonus by illustrating a specific trade you can make with this stock selected.
The AMD trade serves as an excellent illustration of the potential of what we call a Breaking News Trade. Well-chosen breaking news catalysts have the ability to significantly impact a trader’s day, month, or even entire year.
Now, let’s teach you a profitable way to trade this specific breaking news catalyst.
We observe a significant increase in volume at point #2 when the breaking news is released. The lowest point of the corresponding candle, which we refer to as the “’undisturbed price”, holds great significance.
If the stock’s price drops below this level, where the surge in volume occurred, it indicates that market participants are unwilling to support and defend that price. Moreover, those who entered long positions based on the news find themselves in a losing position.
This precisely makes the “undisturbed price” an exceptional level to set risk against.
#3 $WAL
*Please note that the prices and other statistics on this page are hypothetical, and do not reflect the impact, if any, of certain market factors such as liquidity, slippage and commissions.
$WAL is an example of a technical catalyst.
We score this example 9/10. This is due to the unusual and unstainable recent price action in $WAL.
It is a liquid stock. It met our range criteria for a Stock In Play. RVOL was greater than 3 at the time of the trade.
As a bonus, I will offer a trade example to explain the opportunity in this technical catalyst best.
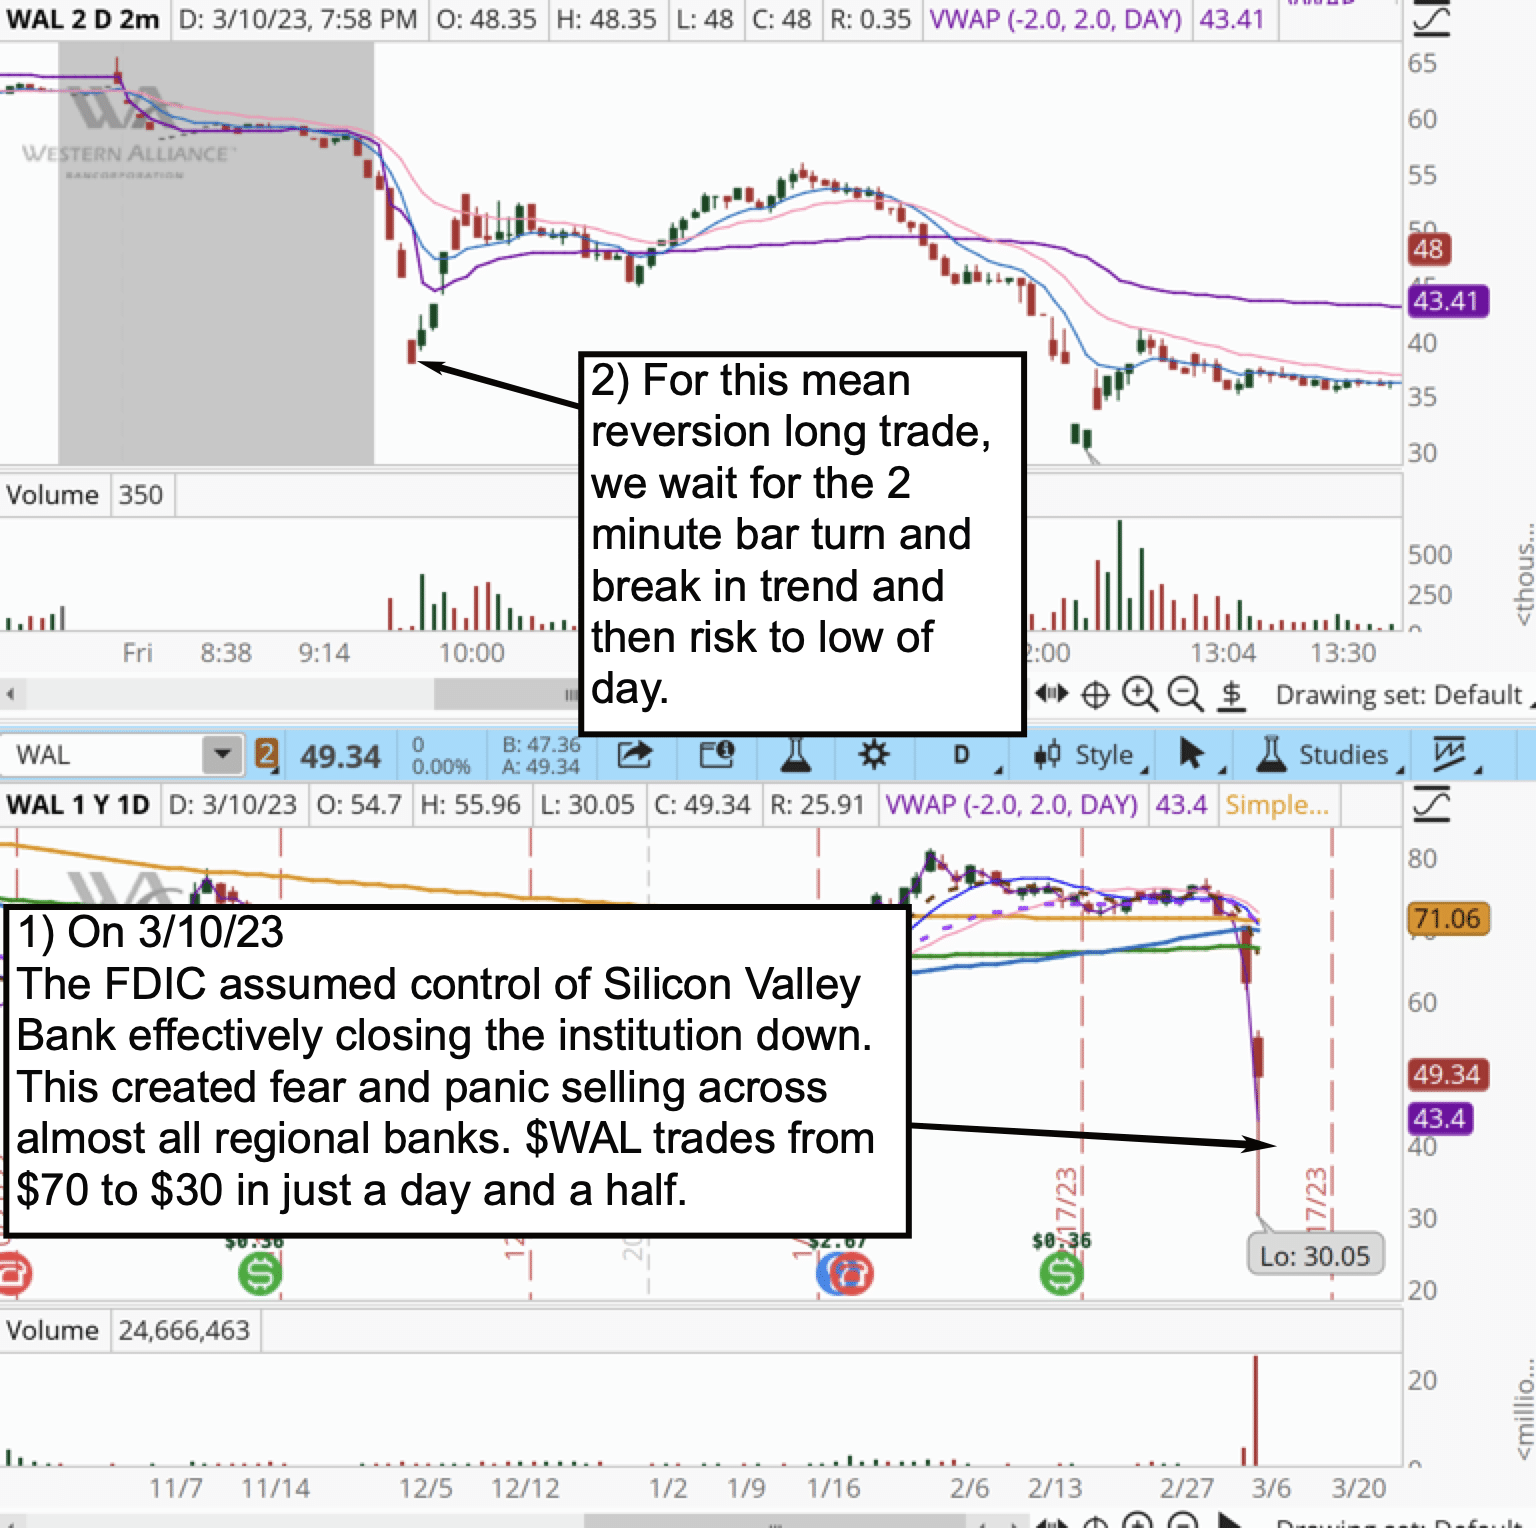
Let’s look at an example of a mean reversion trade, which occurs when a stock experiences significant moves, either up or down, beyond multiple Average True Ranges (ATRs), within a short span of time.
In my approach, I quantify this as 5 ATRs from a 5-day low or high. Here, we have an illustrative case with $WAL, where I’d like to provide further insight into entry point #2 on the chart, where we enter long on a 2-minute bar break of the downtrend.
Something that might not be immediately apparent to novice traders is that the faster and steeper a stock’s price moves, the higher the likelihood of a snapback. Stocks are sometimes compared to rubber bands— the more they are stretched, the stronger the snapback.
In this particular scenario, we observe a rapid ascent from $35 to $54, within an hour once the selling pressure subsides, and the downtrend is broken with notable volume… This is an extreme version.
$WAL has the potential to continue being a favorable stock for trading this year due to several reasons:
- Bank Failures: Recent instances of regional bank failures, including Silicon Valley Bank, Signature Bank, and First Republic Bank, have created a dynamic environment in the banking sector.
- Bank Mergers: The challenging landscape has compelled several regional banks to merge with larger institutions to ensure survival and navigate the changing market conditions.
- Reduced Lending: Regional banks have been scaling back on lending to businesses and consumers in recent years. This decline in lending activity has posed challenges for businesses seeking expansion opportunities and consumers aiming to make significant purchases such as homes and cars.
These factors contribute to the potential trading opportunities $WAL may offer this year. By carefully monitoring market conditions and employing effective trading strategies, day traders can potentially capitalize on the evolving dynamics of the banking sector and fluctuations in $WAL’s price.
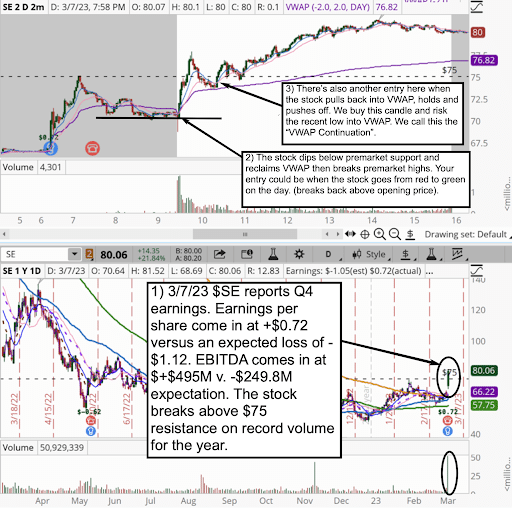
#4 SE
*Please note that the prices and other statistics on this page are hypothetical, and do not reflect the impact, if any, of certain market factors such as liquidity, slippage and commissions.
This is an example of a news catalyst.
We score this catalyst 10/10.
Why?
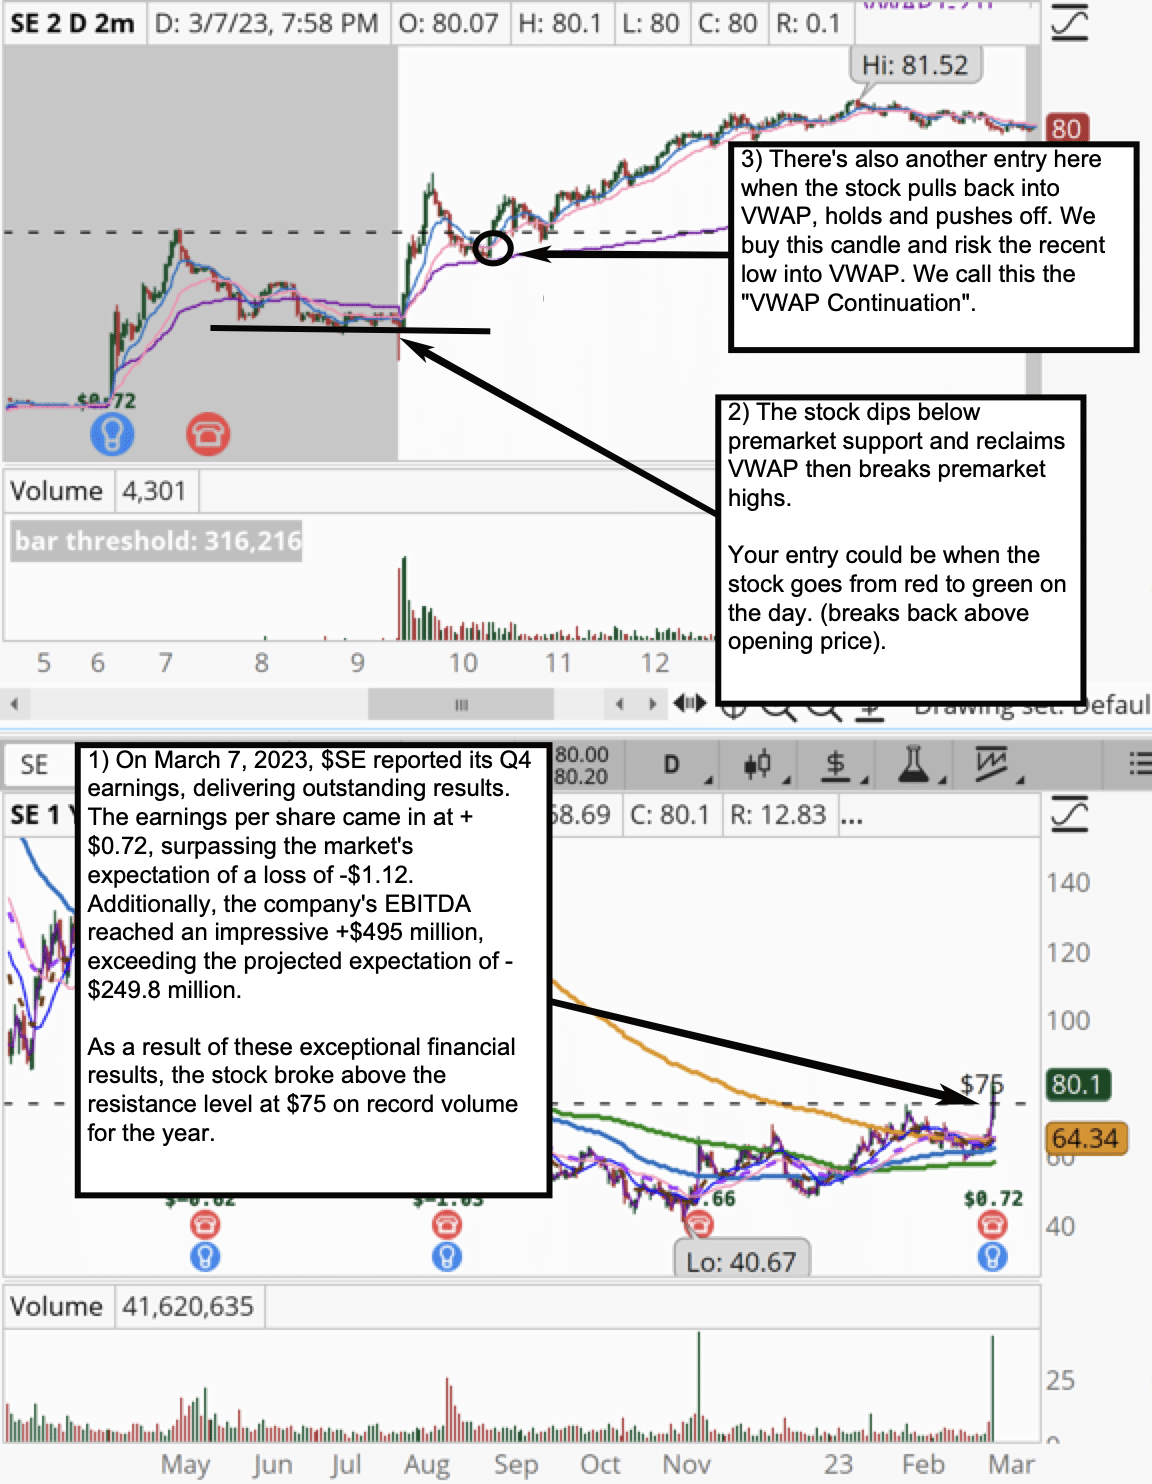
The earnings beat by SE provided an excellent opportunity for what we call a Changing Fundamentals trade. This is one of our favorite trades on the desk and one of the very best for new traders.
SE announced unusually positive news during its earnings report. This is particularly important because the underlying business of SE is materially more attractive after this earnings report than the day before. This will attract the attention of big money traders.
What made this trade even more enticing was the presence of a higher time frame technical breakout. Adding to the appeal: The stock is trading above key simple moving averages (200, 100, 50, 20, 10).
It is a liquid stock. It met our range criteria for a Stock In Play. RVOL was greater than 3 at the time of the trade.
Now as a bonus for you, let’s delve into the entry point highlighted at point #3 on the chart. This day trading setup, known as the VWAP Continuation, is particularly advantageous for beginners due to the following reasons:
1. Confirmation of Strength: With the VWAP Continuation, you aim to capture a second leg of the stock’s upward movement after it has already demonstrated its strength. This setup eliminates any guesswork regarding direction.
2. VWAP as a Fair Value Reference: The VWAP is a widely used indicator by large institutions to facilitate the execution of significant transactions. It acts as a Fair Value Reference for institutions, serving as a benchmark for determining a stock’s fair value. Traders compare the current price to the VWAP to gauge whether the stock is trading above or below the average price. A stock consistently trading above the VWAP may suggest bullish sentiment, while trading below the VWAP may indicate bearish sentiment.
When we observe the stock trending higher in the morning on high RVOL (Relative Volume), and then pulling back towards VWAP, we can expect the stock to find support in this area. Institutional buyers often seek to add to their positions at fair value, making VWAP an attractive level for potential support.
When the stock bounces off VWAP, we consider going long for a continuation of the trend, setting a stop at the recent low towards the VWAP.
#5 AI
*Please note that the prices and other statistics on this page are hypothetical, and do not reflect the impact, if any, of certain market factors such as liquidity, slippage and commissions.
This is a news catalyst.
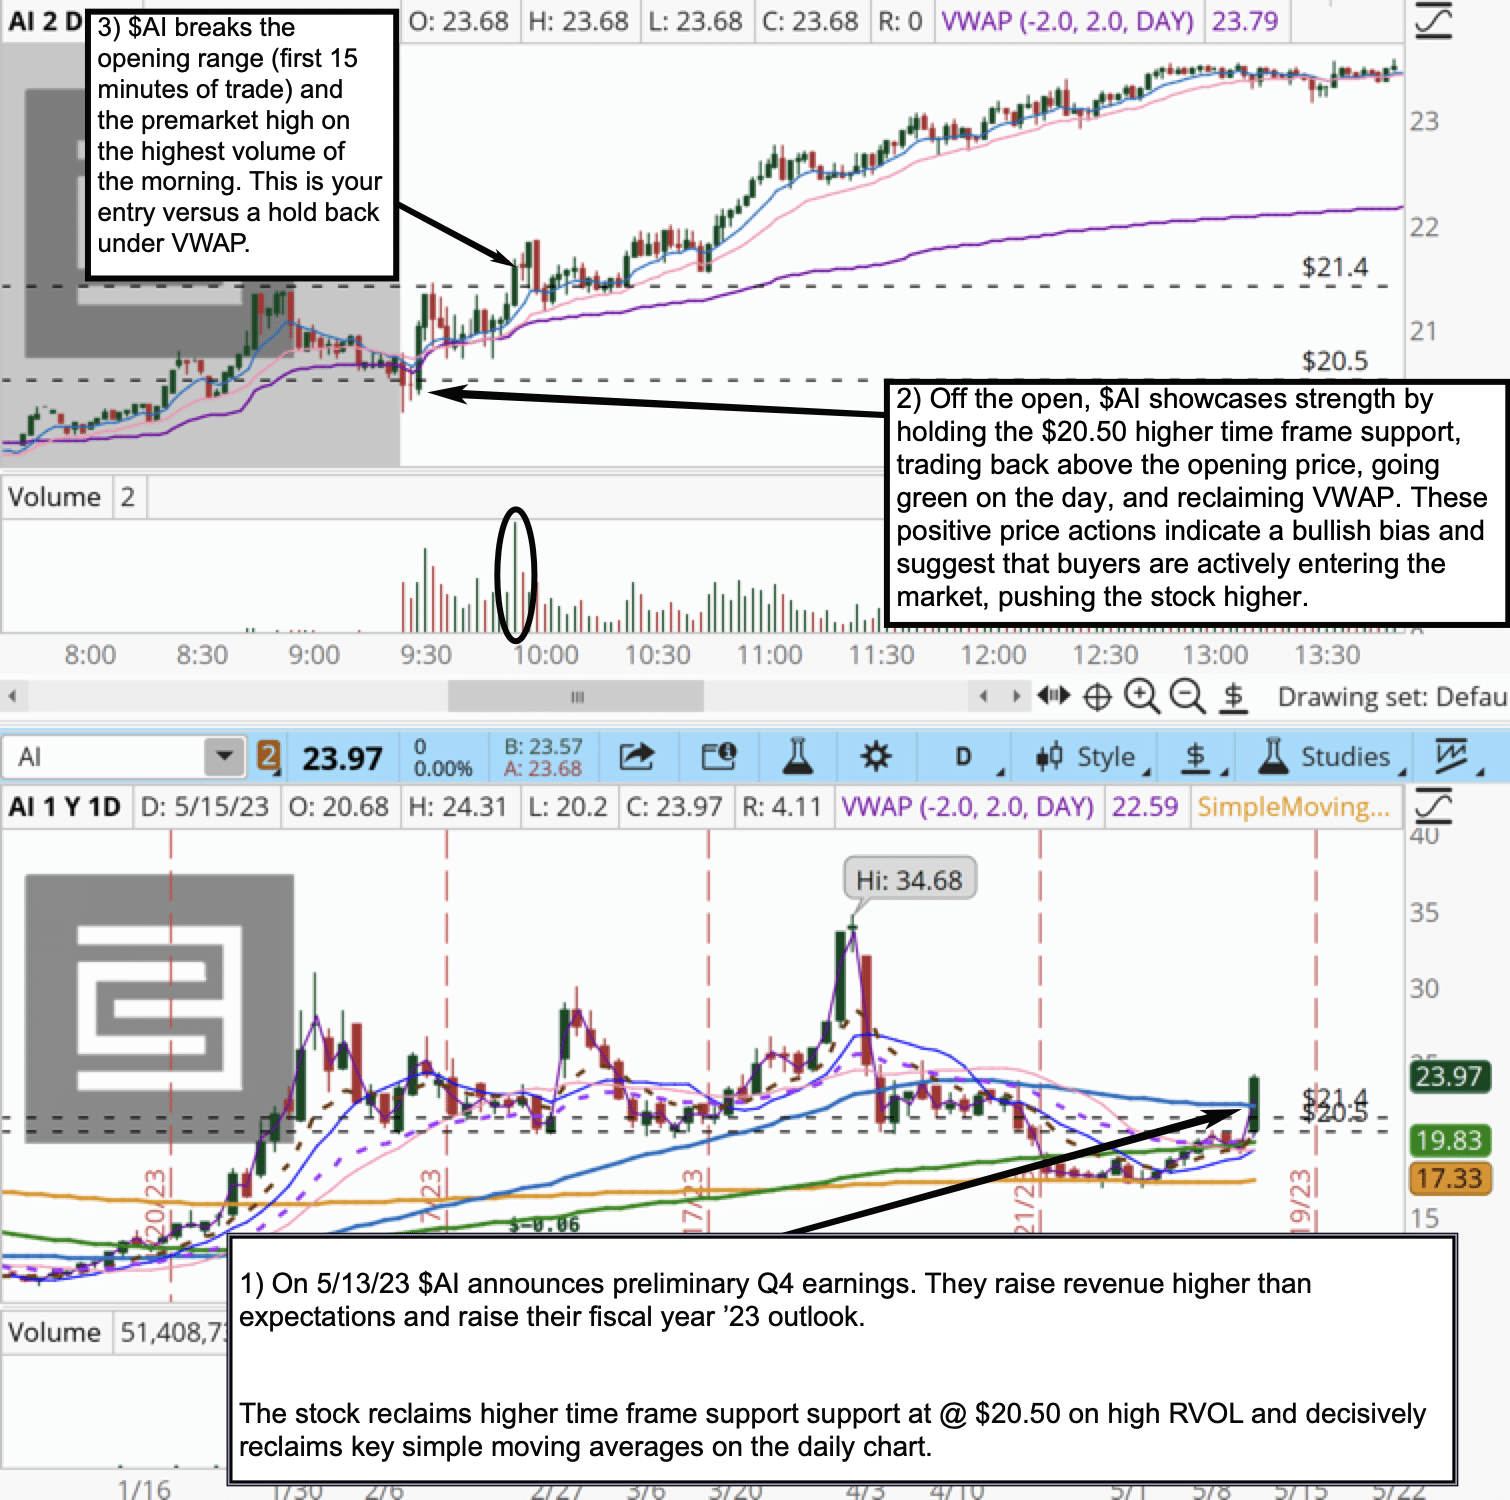
We score this catalyst 9/10. They raised revenue above expectations and raised for the full year, as we note in the chart above.
It is a liquid stock. It met our range criteria for a Stock In Play. RVOL was greater than 3 at the time of the trade.
We want to trade this stock. Let’s again offer a bonus of a specific trade you can make when choosing a Stock In Play like this.
Here I would like to introduce a widely used intraday pattern employed by traders here at SMB— the Opening Range Break. This pattern emerges when an actively traded stock breaks out of its initial 15-minute range, known as the opening range or price discovery phase.
During this phase, price action establishes key levels and a trading range that day traders can utilize for decision-making. When the high or low of the opening range is breached, it often signals the beginning of a trend. Let’s take a closer look at a compelling example of this pattern illustrated at point number 3 on the chart.
Understanding the significance of the opening range is crucial for day traders due to several reasons:
1. Price Discovery: The initial phase of trading, particularly the first 15 minutes, is when price discovery occurs. It is during this time that market participants gauge supply and demand dynamics, set opening prices, and establish a range of trading levels. This price discovery phase provides essential information for day traders to identify potential opportunities and make informed trading decisions.
2. Key Levels and Trading Range: The opening range establishes important levels, such as the high and low of that time frame, which act as reference points throughout the trading day. Traders often observe how the price behaves around these levels, as breakouts or breakdowns from the opening range can indicate shifts in market sentiment and the potential initiation of a trend.
3. Trend Development: When a stock breaks above the high or below the low of the opening range, it frequently signals the emergence of a trend. Day traders keenly watch for these breakouts as they may indicate significant movement and provide potential entry points for trades in the direction of the trend.
Point number 3 on the chart exemplifies an excellent application of the opening range break pattern. By recognizing and capitalizing on these patterns, day traders can enhance their trading strategies and potentially benefit from the subsequent trends that often unfold after the breakout from the opening range.
We expect $AI to continue to be a great day trading vehicle for the following reasons:
- The ticker symbol “AI” is short for “artificial intelligence.”
- Artificial intelligence is a very hot topic in the tech industry so far in ‘23 and we believe it will continue to be for months and years to come.
- Unsophisticated investors saw the ticker symbol as a sign that C3.ai was a leader in the artificial intelligence space.
- The ticker symbol has helped to boost C3.ai’s trading volume which has and will continue to provide great trading opportunities.
#6 $DUOL
*Please note that the prices and other statistics on this page are hypothetical, and do not reflect the impact, if any, of certain market factors such as liquidity, slippage and commissions.
This is an example of a news catalyst.
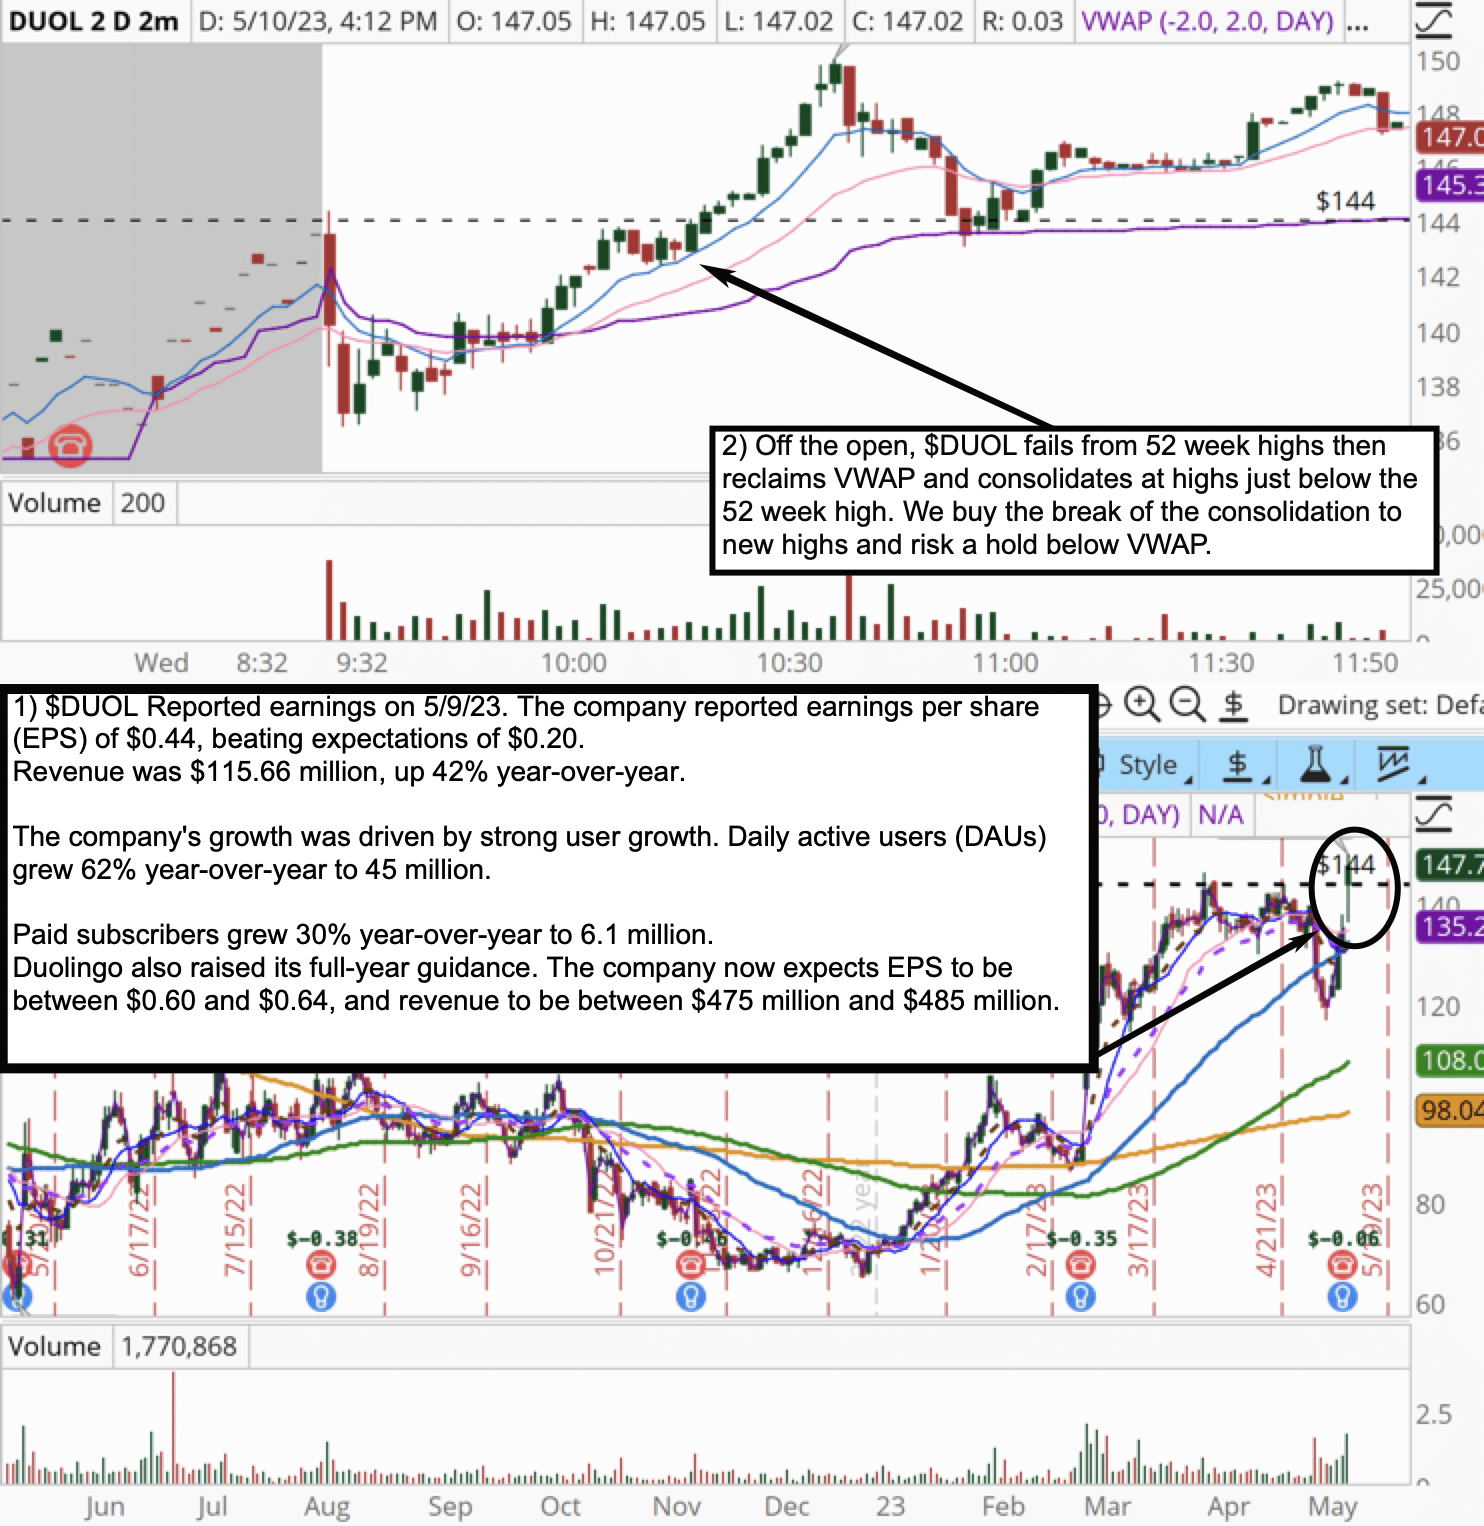
We score this catalyst as 10/10. We score this so high because of the amazing growth of its daily active users. This means the fundamentals of the company are getting significantly stronger.
This stock is liquid. It met our range criteria for a Stock In Play. RVOL was greater than 3 at the time of the trade.
As a bonus…
Here, I present another example of an opening range break, but I want to highlight some unique nuances that make this particular trade special. Notably, the consolidation occurs just below the stock’s high of the day, which also aligns with its 52-week highs. When multiple significant levels coincide, it enhances the importance of the level. At point #2 on the chart, we observe this consolidation, which holds particular significance from a bullish standpoint.
The consolidation near the high of the day and the stock’s 52-week highs suggest a potential breakout opportunity. When multiple key levels align, it amplifies the significance of the level. In this case, the consolidation under these levels signifies a potential bullish bias. Additionally, we can derive further confidence in the bullish view from the fact that the stock initially traded below the VWAP but managed to reclaim and hold above it. This indicates that the shorts (or bears) were unable to maintain control and the longs (or bulls) reclaimed dominance.
Several factors contribute to a bullish stance on this trade. Firstly, the stock delivered a fantastic earnings report, boosting positive sentiment. Secondly, the Relative Volume (RVOL) indicates increased trading activity, suggesting heightened interest and potential momentum. Lastly, the stock’s price trading just below its 52-week highs indicates the potential for a breakout to new highs.
It’s important to note that no two opening range breaks are the same or act in identical ways. Each occurrence has its own unique nuances and characteristics, which should be carefully studied and analyzed. This example, following the AI ORB (opening range break), serves to demonstrate the variations and subtleties present in different opening range break patterns. By thoroughly examining these nuances, traders can refine their strategies and capitalize on the diverse opportunities that arise.
$DUOL Could continue to be a great stock to trade off of earnings reports due to the following:
- Strong user growth: Duolingo’s user growth has been impressive in recent quarters. The company’s DAUs grew 62% year-over-year in the most recent quarter, and its paid subscribers grew 30% year-over-year. This growth is being driven by the company’s freemium business model, which allows users to access the majority of its content for free while charging a subscription fee for premium features.
- Global expansion: Duolingo is expanding its reach into new markets. The company recently launched its app in India, and it plans to launch in other major markets in the coming months. This expansion will help Duolingo to reach a wider audience and to grow its user base.
- New product launches: Duolingo is launching new products that could help to drive growth. The company recently launched a new language learning app for kids, and it is also working on a new product that will allow users to learn languages through virtual reality. These new products could help Duolingo to attract new users and to grow its revenue.
#7 SCHW Mean Revision 3/13
*Please note that the prices and other statistics on this page are hypothetical, and do not reflect the impact, if any, of certain market factors such as liquidity, slippage and commissions.
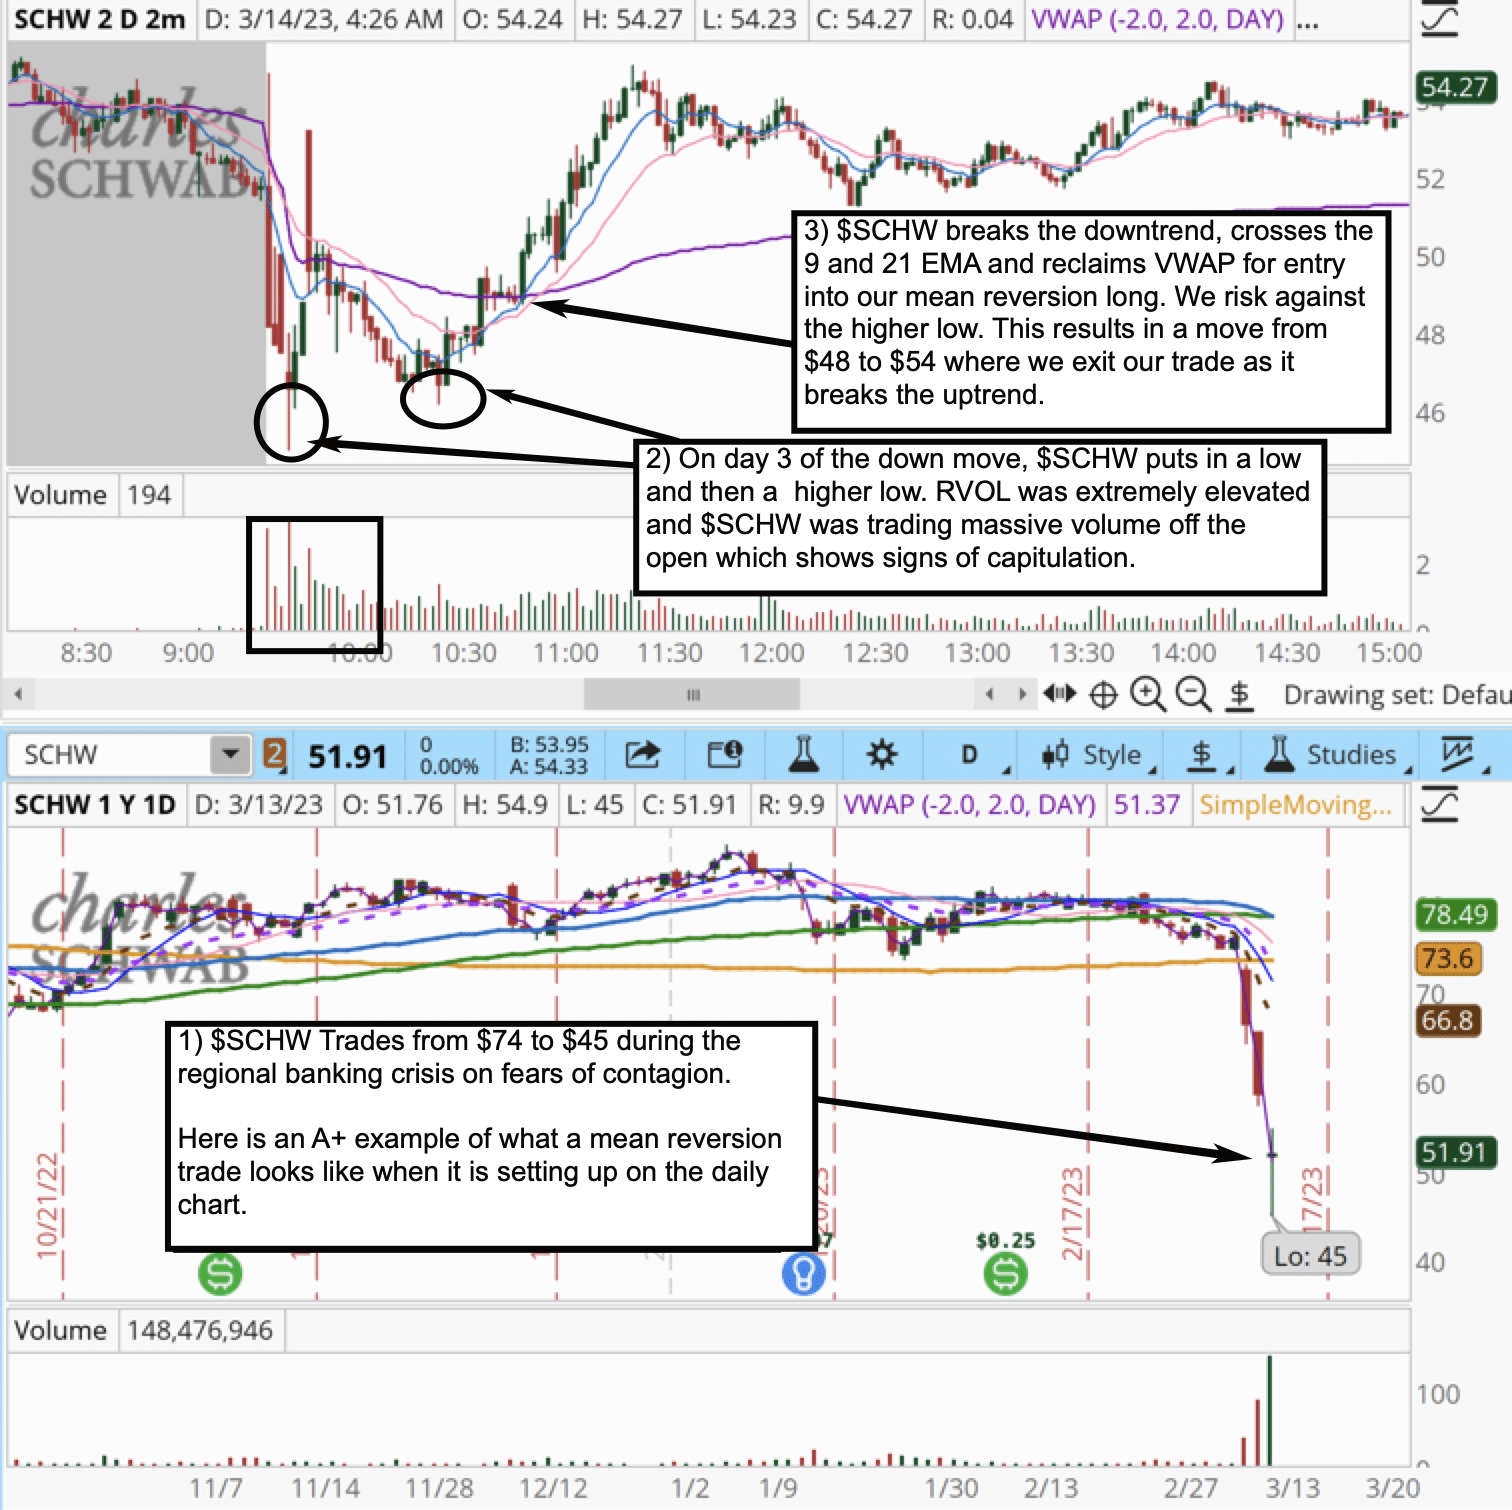
This is an example of a technical catalyst.
We score this technical catalyst 9/10. The extreme price action is unsustainable and sets up a bread-and-butter trade for day traders.
$SCHW is liquid. It met our range criteria for a Stock In Play. RVOL was greater than 3 at the time of the trade.
As a bonus…
$SCHW is another example of a mean reversion trade where the ‘rubber band’ effect comes into play. However, the method of entry, in this case, differs from the previous mean reversion trade showcased in $WAL. $SCHW has experienced a rapid decline of over 5 Average True Ranges (ATRs) within just three days, putting the stock on our mean reversion radar.
At the market open, the initial price movement is downward, but then something interesting occurs. The stock undergoes a strong squeeze above the Volume Weighted Average Price (VWAP), which ultimately turns out to be a trap. A day trading trap is a move that catches both longs and shorts off guard.
In this scenario, longs are trapped as the big squeeze over VWAP fails, and shorts are also stopped out of their positions, compelled to cover when the stock surges above VWAP. We can consider this as a significant ‘reset’ event.
Subsequently, an intriguing development takes place. The stock trades back below VWAP but forms what we refer to as a ‘higher low.’ A higher low indicates that a buyer is willing to step in and support the stock at a higher price, serving as a precursor or a small clue that the stock has the potential to trade higher.
However, we exercise caution and wait for further evidence to confirm this potential. That confirmation arises when the stock holds above VWAP once again. At this point, we enter a long position, leveraging the higher low as a risk level, and ride the trend from $49 until it breaks just below $54.
$SCHW could continue to be a great bank to trade off the news in the financial sector due to the following reasons:
- Schwab is a large, well-established financial institution with a long history of stability and profitability.
- Schwab has a strong balance sheet with a significant amount of cash and liquid assets.
- Schwab is a leader in the discount brokerage industry with a large and loyal customer base.
I should mention that having the right stocks to trade is only half the battle. You also need robust strategies to trade those stocks if you’re going to make money. So if you want to learn (in step-by-step detail) 3 of our top strategies with a robust, proven edge, head over to tradingworkshop.com now. You won’t get a better education than from a firm with over 50 professional traders who pull in millions from the markets month in and month out. And it’s 100% free for you to join, so if you’re serious about trading, you can’t afford to miss it.
#8 $MU
*Please note that the prices and other statistics on this page are hypothetical, and do not reflect the impact, if any, of certain market factors such as liquidity, slippage and commissions.
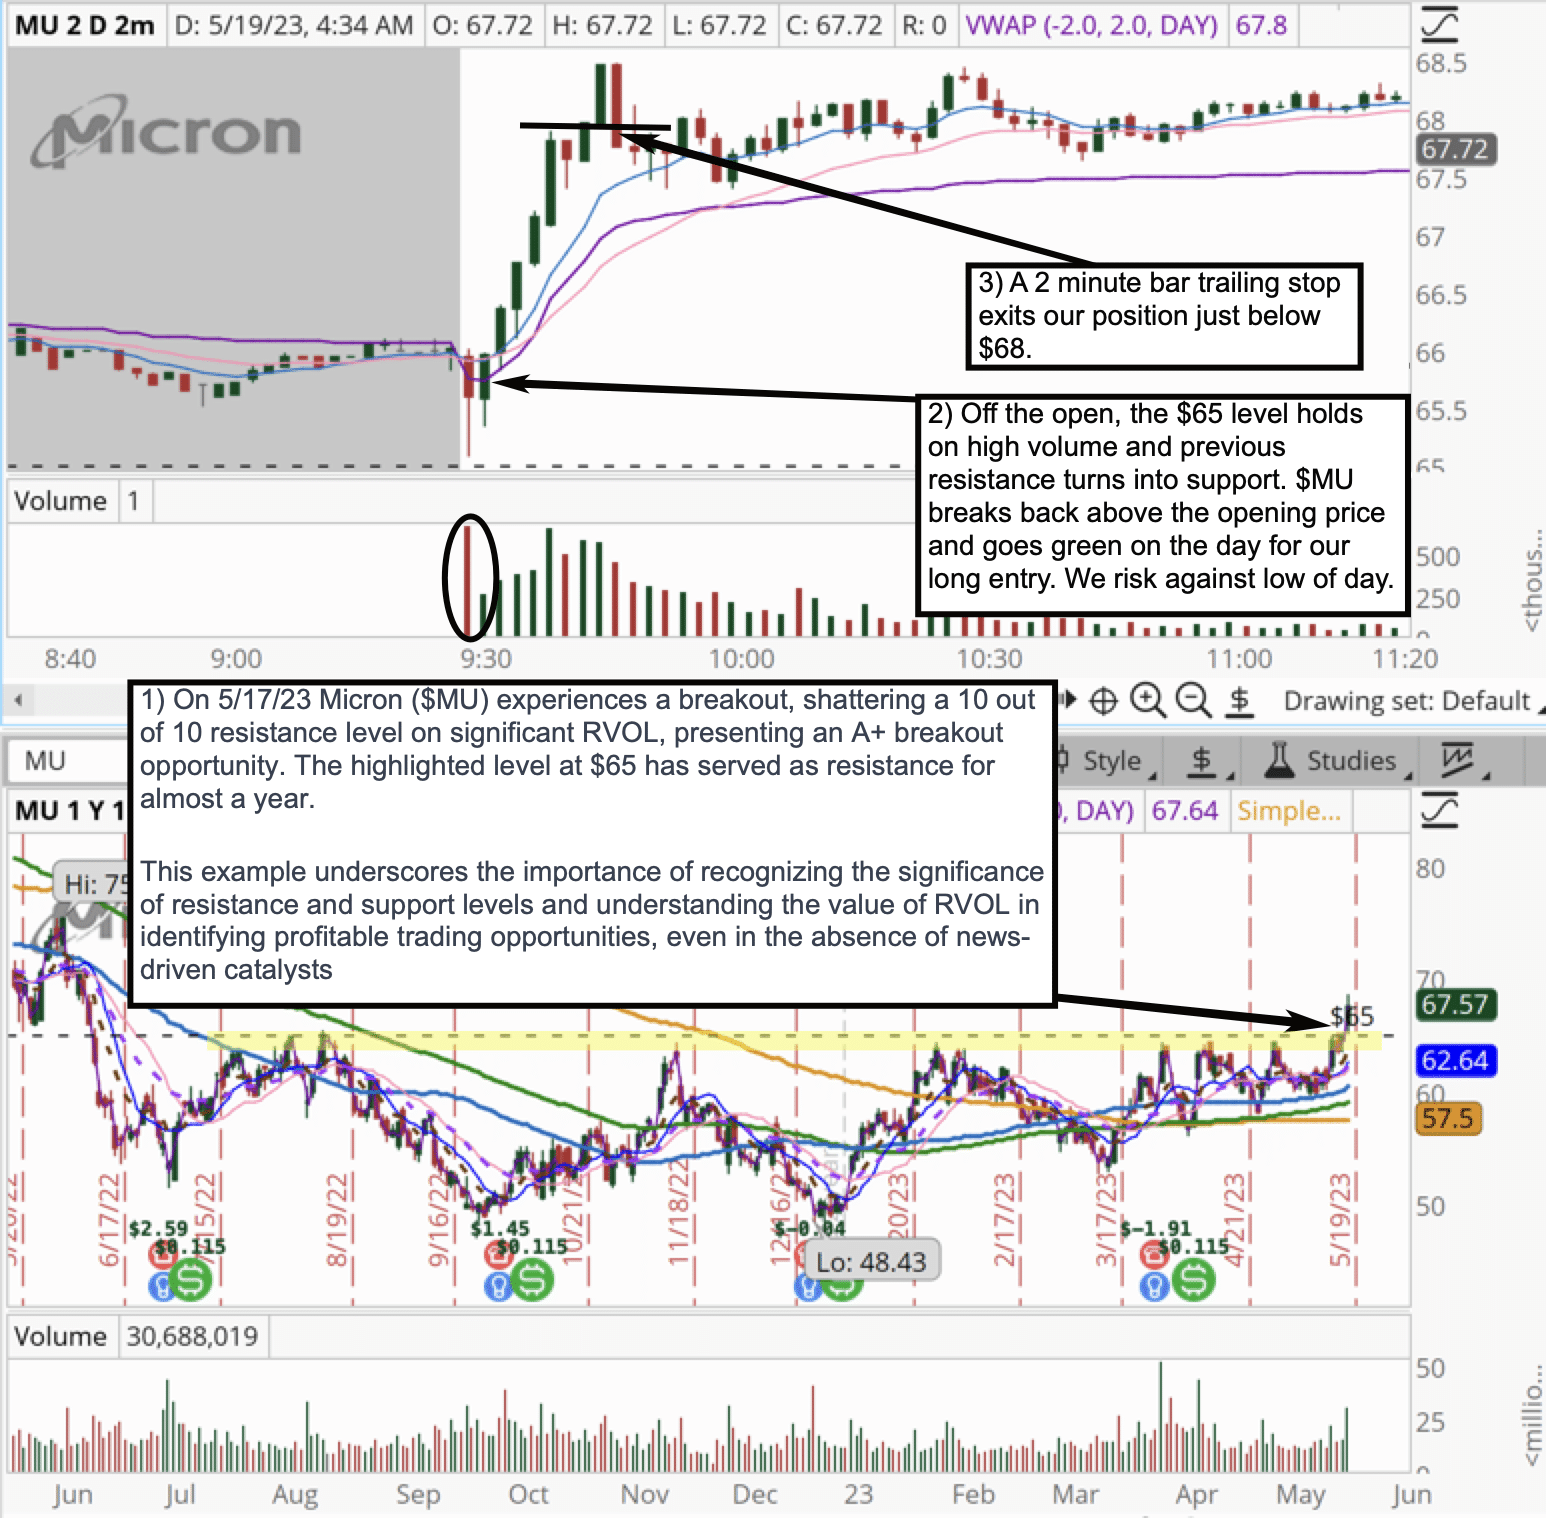
MU is an example of a technical catalyst.
We score this catalyst 10/10.
MU is a liquid stock. It met our range criteria for a Stock In Play. RVOL was greater than 3 at the time of the trade.
Micron ($MU) is an excellent example of how a break of a significant technical level can act as a catalyst. On the chart, it is evident that the $65 level has served as strong resistance for MU for nearly a year. At SMB, our traders often rate support and resistance levels on a scale of 1 to 10, with 10 representing the strongest. I would give this $65 level a solid 10 rating.
As a bonus for you see the chart above, which is marked up identifying a terrific trade you can make.
During this trade opportunity, the overall market exhibited strength, and the semiconductor sector was also performing well. These tailwinds from the broader market and the sector added significant weight to the trade’s potential success.
When observing the opening action, I noticed that $MU’s Relative Volume (RVOL) was unusually high. This signaled that other traders, especially significant players in the market, were also interested in the breakout. The setup became even more apparent to me when $MU dipped lower after the open on substantial volume, but then held its ground and turned back green on the day, surpassing the opening price. This price action confirmed the breakout and served as my entry signal. The fact that the 10 out of 10 resistance level had now proven to act as support further reinforced my decision.
We believe $MU will continue to present trading opportunities in 2023 due to the following:
- Micron is a leader in the memory chip market which stands to benefit from the adoption of AI.
- The memory chip market is expected to grow in the coming years.
- Micron has a strong balance sheet.
- Micron has a history of innovation.
#9 $MARA
*Please note that the prices and other statistics on this page are hypothetical, and do not reflect the impact, if any, of certain market factors such as liquidity, slippage and commissions.
Cryptocurrencies have made headlines for the past many years. This is certainly a hot sector, offering many days of amazing trading opportunities. We wanted to give you a taste of how and when to trade them as well.
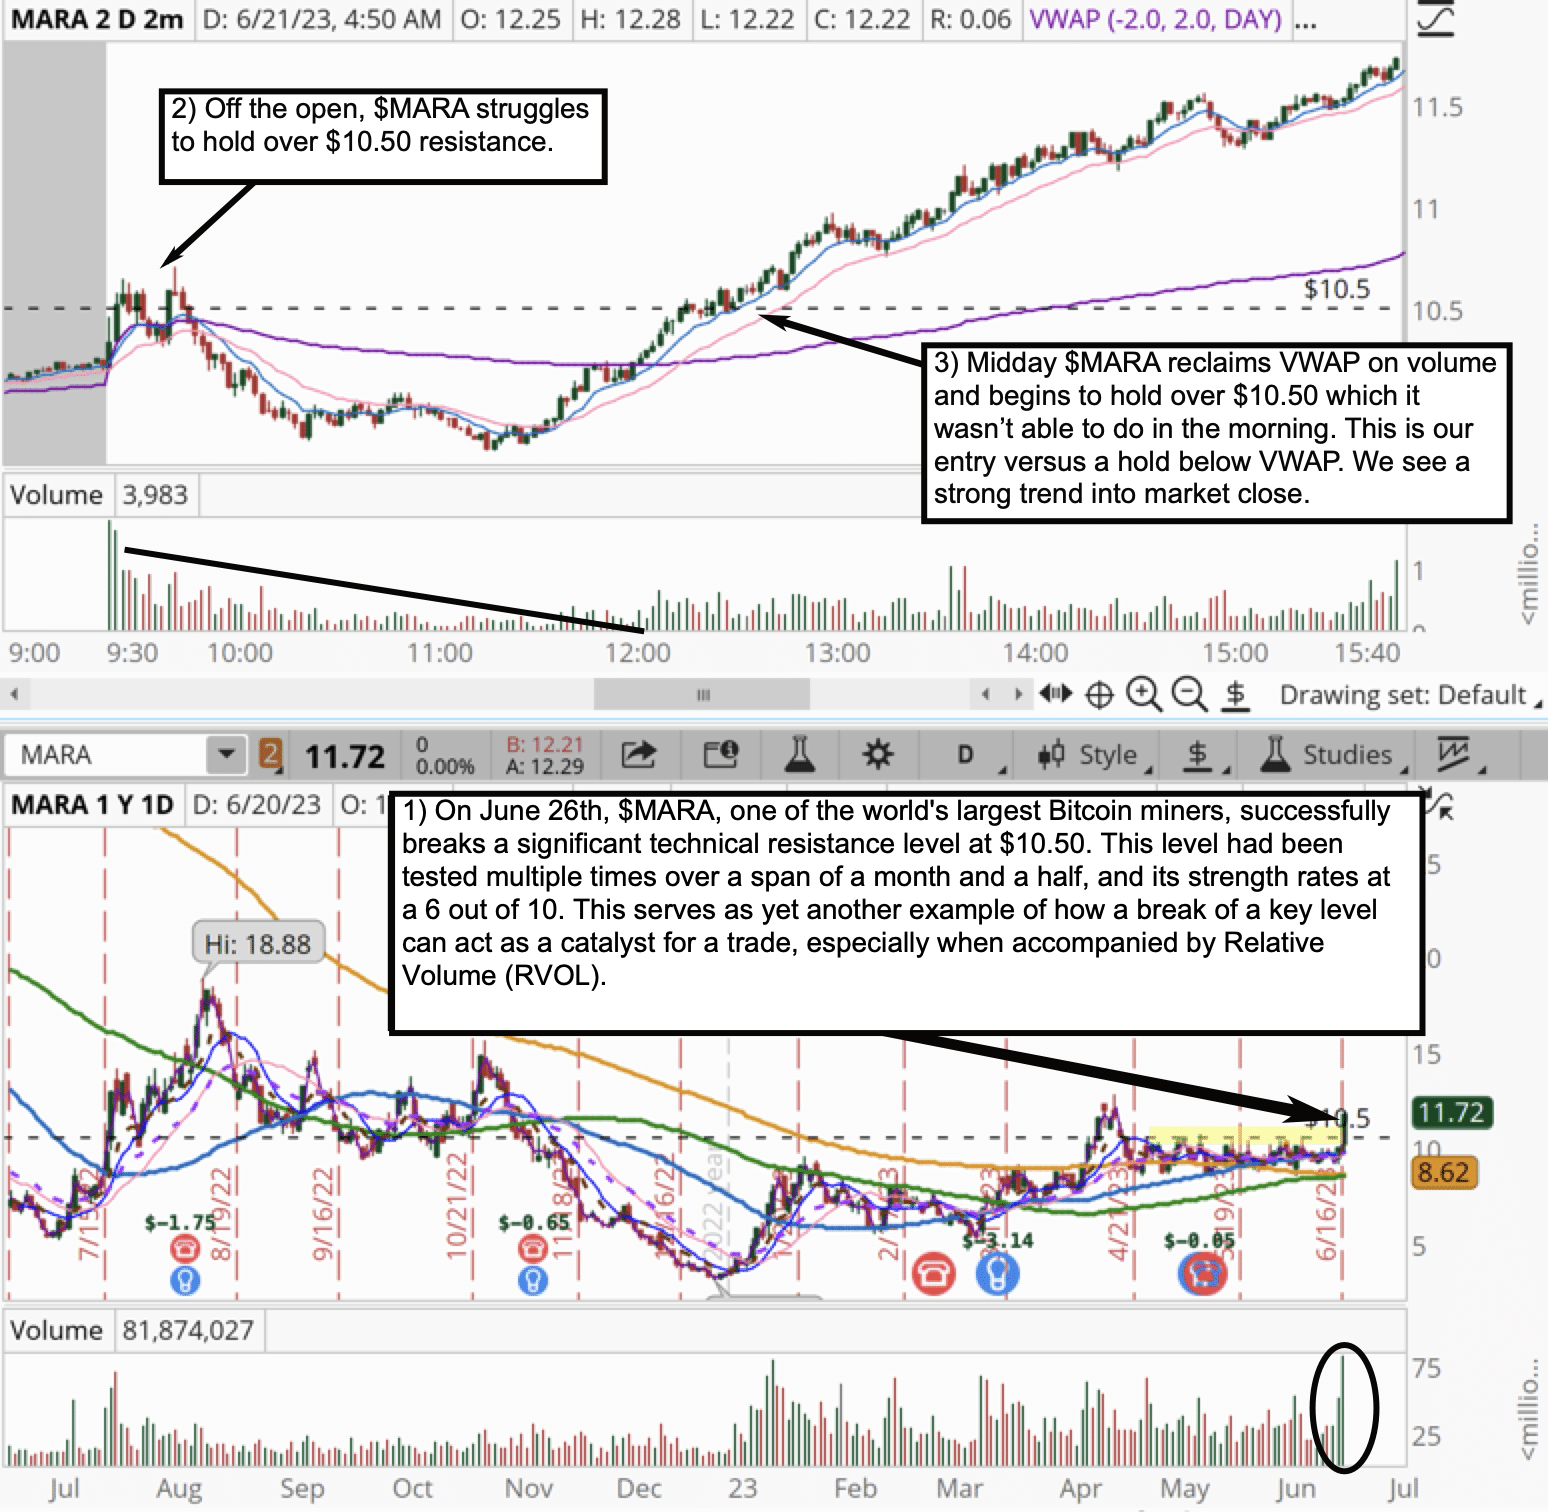
Here is another example of a technical breakout, where the level acts as the catalyst, although this time the level is not as strong. I would rate the $10.50 level a 6 out of 10, considering that it had acted as resistance for a month and a half and failed to break through about seven times during that period.
While I wasn’t actively monitoring this trade, I had set up alerts (a trader’s best friend). I received my alert as the market opened, and when it failed to break through the level, I simply reset my alert and continued monitoring my list of in-play stocks.
Later in the afternoon, I received another alert that $MARA was once again approaching the $10.50 level. This time, it was holding and consolidating after reclaiming the Volume Weighted Average Price (VWAP), and the volume started trending higher. I noticed similar nuances and patterns to the #6 $DUOL breakout example. Additionally, I observed that the 9-day Exponential Moving Average (EMA) was acting as support during the uptrend, indicating a robust trend with a highly interested buyer(s).
Given that $MARA is a Bitcoin miner, before entering a position, I checked the chart of BTC and noticed that Bitcoin itself was also breaking out, accompanied by increasing volume. These tailwinds further supported my decision.
With the favorable conditions aligning, I initiated a long position, with a risk management strategy of closing the position if the price falls and closes below the 21-day EMA.
By being alerted to the potential breakout, and recognizing the supporting factors such as volume, trend support, and overall market conditions, I made an informed decision to capitalize on the breakout opportunity in $MARA
Again, I want to highlight that by recognizing the significance of the resistance level and understanding the importance of RVOL, traders can identify profitable opportunities even without news-driven catalysts.
$MARA could be a great stock to trade in sympathy to Bitcoin due to the following:
- BlackRock’s potential Bitcoin ETF could be beneficial to MARA because it could lead to a significant increase in demand for Bitcoin.
- Bitcoin mining is a growing industry because the global hash rate has been growing steadily in recent years.
- MARA is a leading Bitcoin miner because it is one of the largest Bitcoin miners in the world and could continue to increase in price if BTC holds above $30k.
#10 $FSLR
*Please note that the prices and other statistics on this page are hypothetical, and do not reflect the impact, if any, of certain market factors such as liquidity, slippage and commissions.
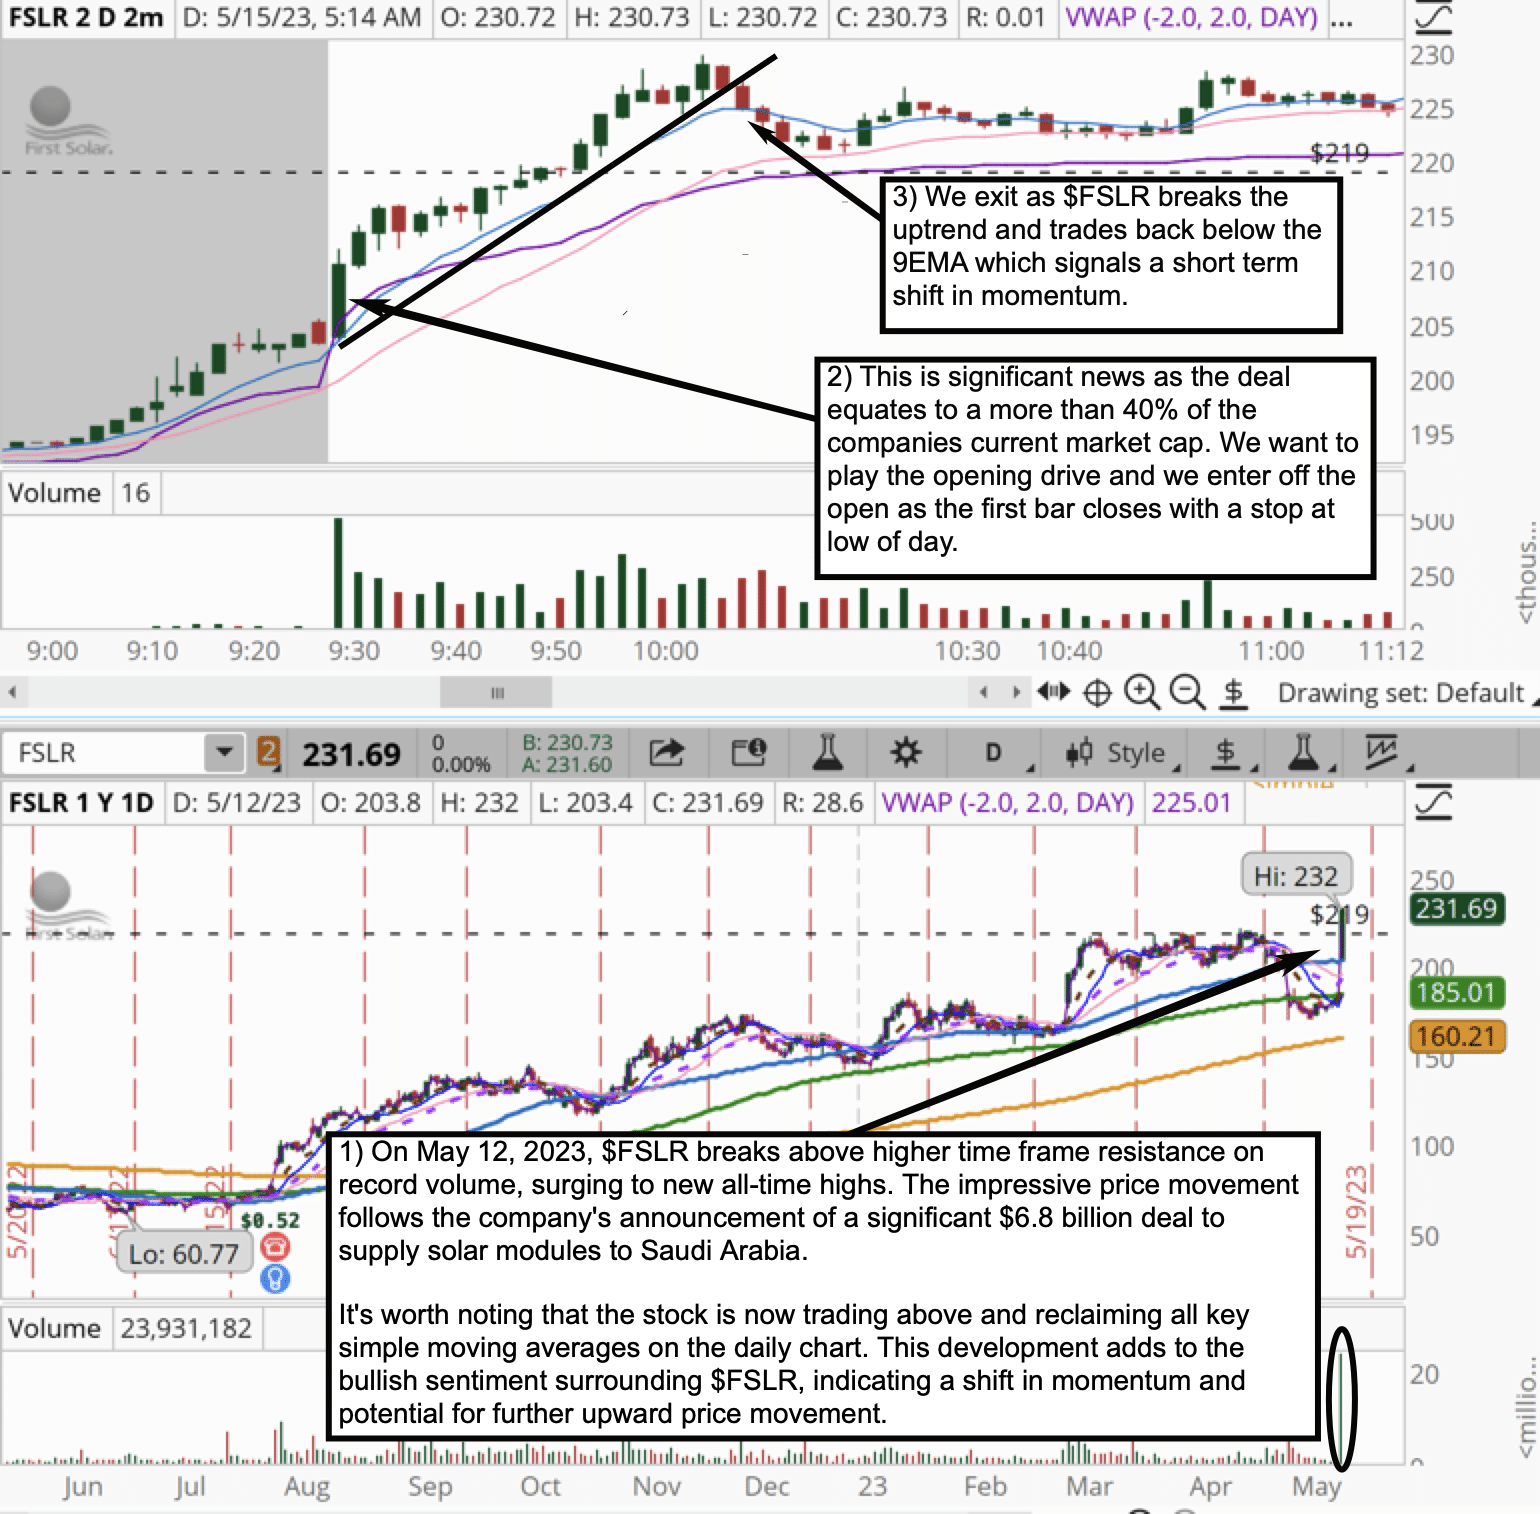
This is an example of a news catalyst.
We score this catalyst as 9/10.
FSLR is a liquid stock. It met our range criteria for a Stock In Play. RVOL was greater than 3 at the time of the trade.
At SMB, we frequently emphasize that the best trading opportunities arise from imbalances in the market where significant players are compelled to buy or sell. This case exemplifies a scenario with a substantial change in fundamentals, prompting the big players to increase their positions due to the significant impact the deal would have on First Solar’s bottom line. These are the A+ trades that offer exceptional potential.
A highly positive catalyst often serves as the precursor for a breakout to new all-time highs. This is what we refer to as ‘blue sky territory,’ a situation where no more resistance levels are impeding the stock’s upward trajectory.
The remarkable aspect of these trades is that sometimes we must act swiftly as soon as we witness the strength of the stock. This is what we commonly term an Opening Drive.
Nuances of an Opening Drive Trade involve
1. Momentum at the Open: An Opening Drive Trade takes advantage of the stock’s significant momentum right from the market open. The stock exhibits strength, often propelled by positive news or a catalyst, leading to a surge in buying pressure.
2. Quick Entry: Timing is crucial in an opening drive trade. Traders must enter the trade promptly as they observe the stock’s initial surge and strong buying activity, ensuring they capture the potential gains early in the move.
3. Managing Risk: While the Opening Drive Trade offers excellent profit potential, it is essential to manage risk effectively. Setting a stop-loss order at a strategic level, such as below the initial pullback, low of day, or below the opening print, helps protect against a reversal.
As a bonus, please see the chart above for an example of how to take an Opening Drive Trade with $FSLR on this opportunity.
We expect $FSLR to continue to present day trading opportunities for the foreseeable future due to the following:
- The solar panel market is expected to grow in the coming years.
- The demand for solar panels is expected to grow as more and more countries adopt renewable energy policies.
- First Solar is a profitable company.
- First Solar has been profitable in recent quarters.
- First Solar is expected to remain profitable in the future.
- First Solar is a volatile stock.
- First Solar’s price can fluctuate significantly in a short period of time providing good day trading opportunities.
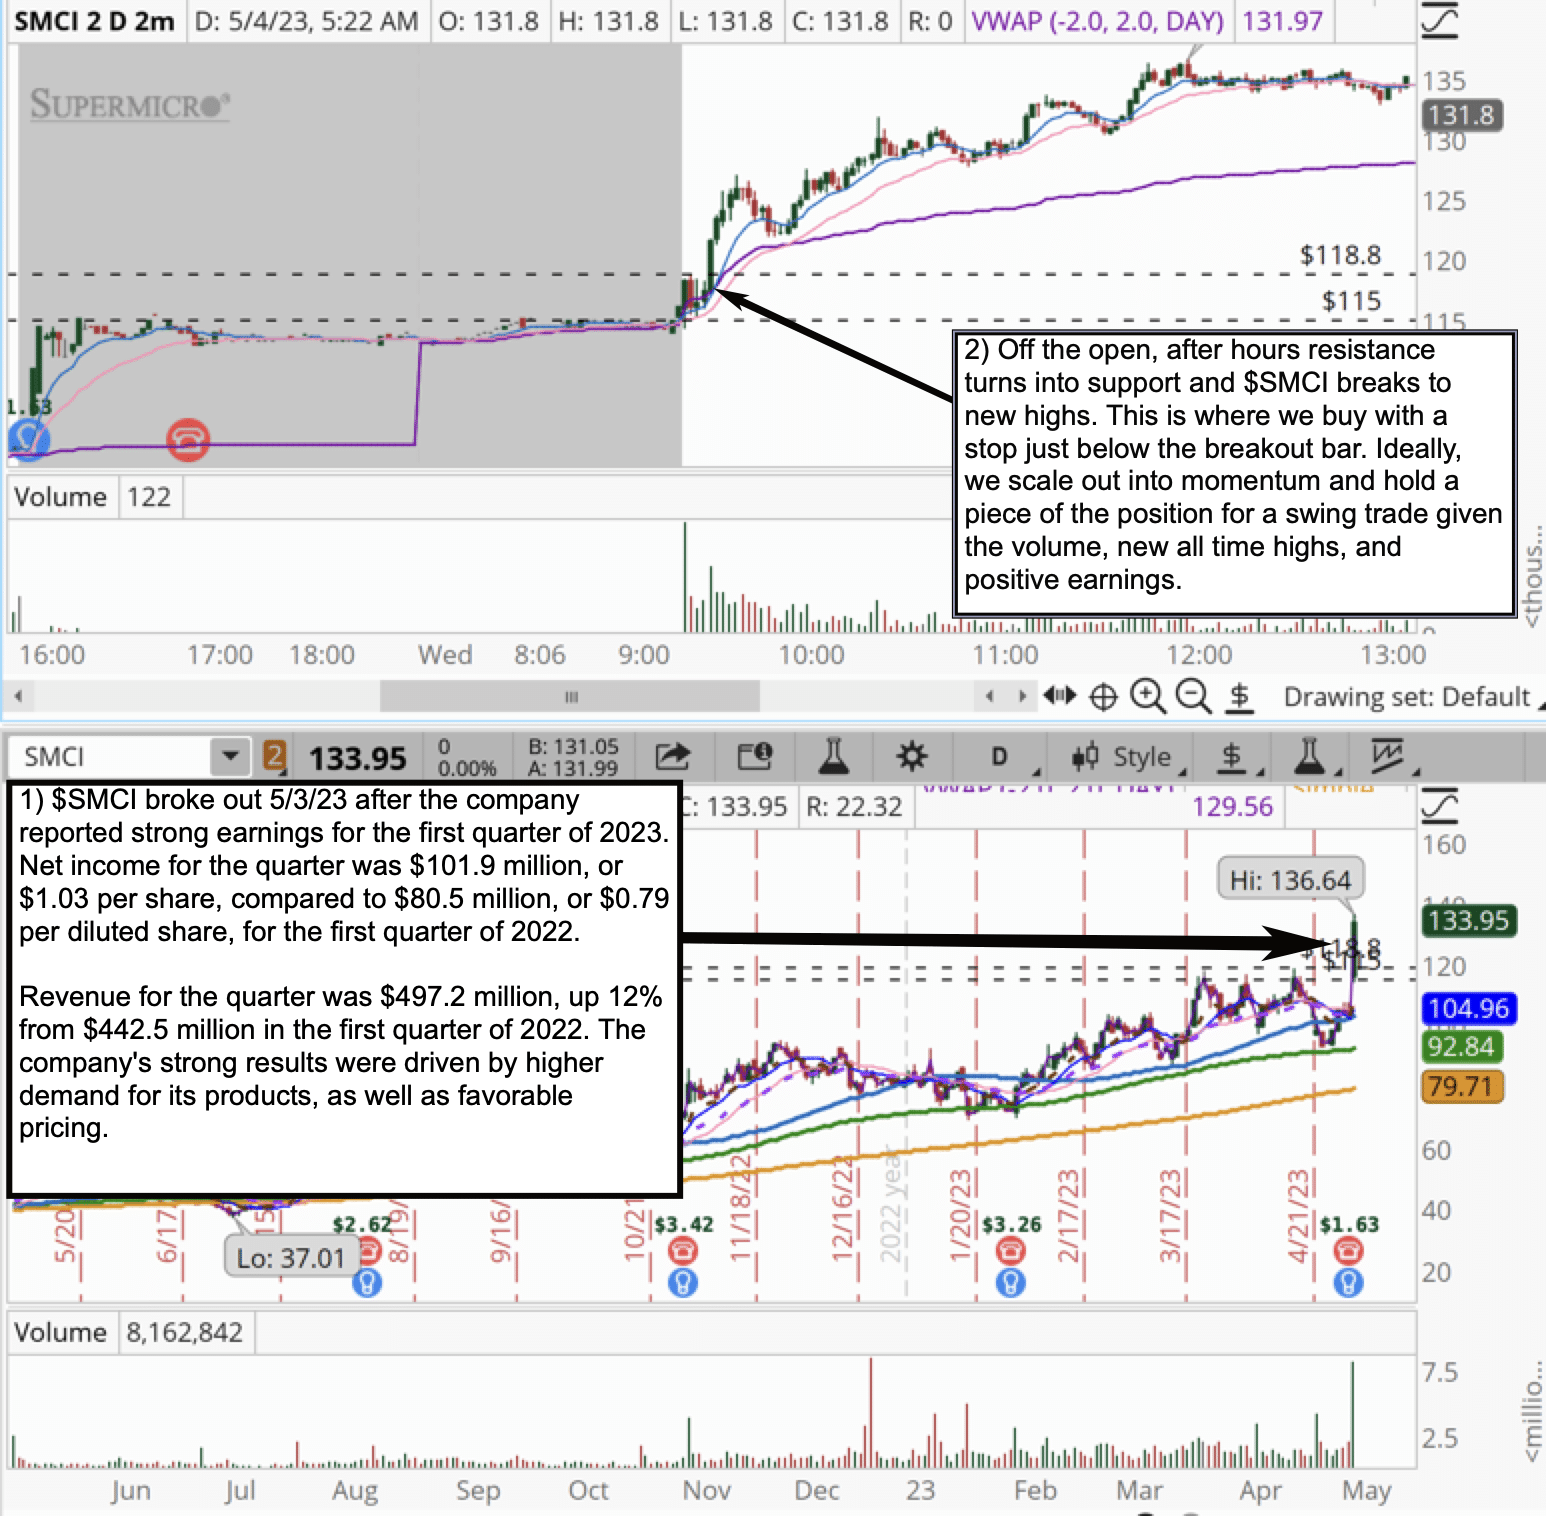
#11 SMCI 5.3.23 earnings
*Please note that the prices and other statistics on this page are hypothetical, and do not reflect the impact, if any, of certain market factors such as liquidity, slippage and commissions.
This is an example of a news catalyst.
We score this news catalyst as a 9. Mostly because the demand for its products are driving higher as well as enjoying strong pricing power.
SMCI is a liquid stock. It met our range criteria for a Stock In Play. RVOL was greater than 3 at the time of the trade.
As a bonus…
In this example, I want to showcase one of the strongest intraday earnings patterns traders often encounter. By examining the 2-minute chart, we can observe a significant gap up in the stock price following the earnings release, followed by a period of consolidation that holds the gains as a sort of shelf leading into the market open.
Once the market opens, we witness a surge in trading volume, and the premarket resistance swiftly transforms into a solid support level. If we look closer, we notice that this level is not the only element being supported. The Volume Weighted Average Price (VWAP), along with the 9 and 21 Exponential Moving Averages (EMA), also act as additional support areas. These multiple checks in our favor provide valuable clues about the strength of the buying pressure in the stock.
During a strong bull market, we often witness numerous positive earnings setups that resemble this particular pattern. The combination of a gap-up, consolidation, and subsequent support breakouts accompanied by strong buying pressure(volume) indicates a bullish trend and offers favorable trading opportunities.
$SMCI continues to trade strong and we expect this to continue for a few reasons:
- The server and storage market is growing.
- The demand for servers and storage is expected to grow in the coming years.
- SMCI is a leading provider of servers and storage solutions.
- SMCI has a strong financial position.
- SMCI has a strong balance sheet and a history of profitability.
- SMCI has the ability to invest in new products and technologies.
- SMCI’s stock is undervalued.
- SMCI’s stock is currently trading at a relatively low valuation.
- There is potential for the stock to appreciate in value.
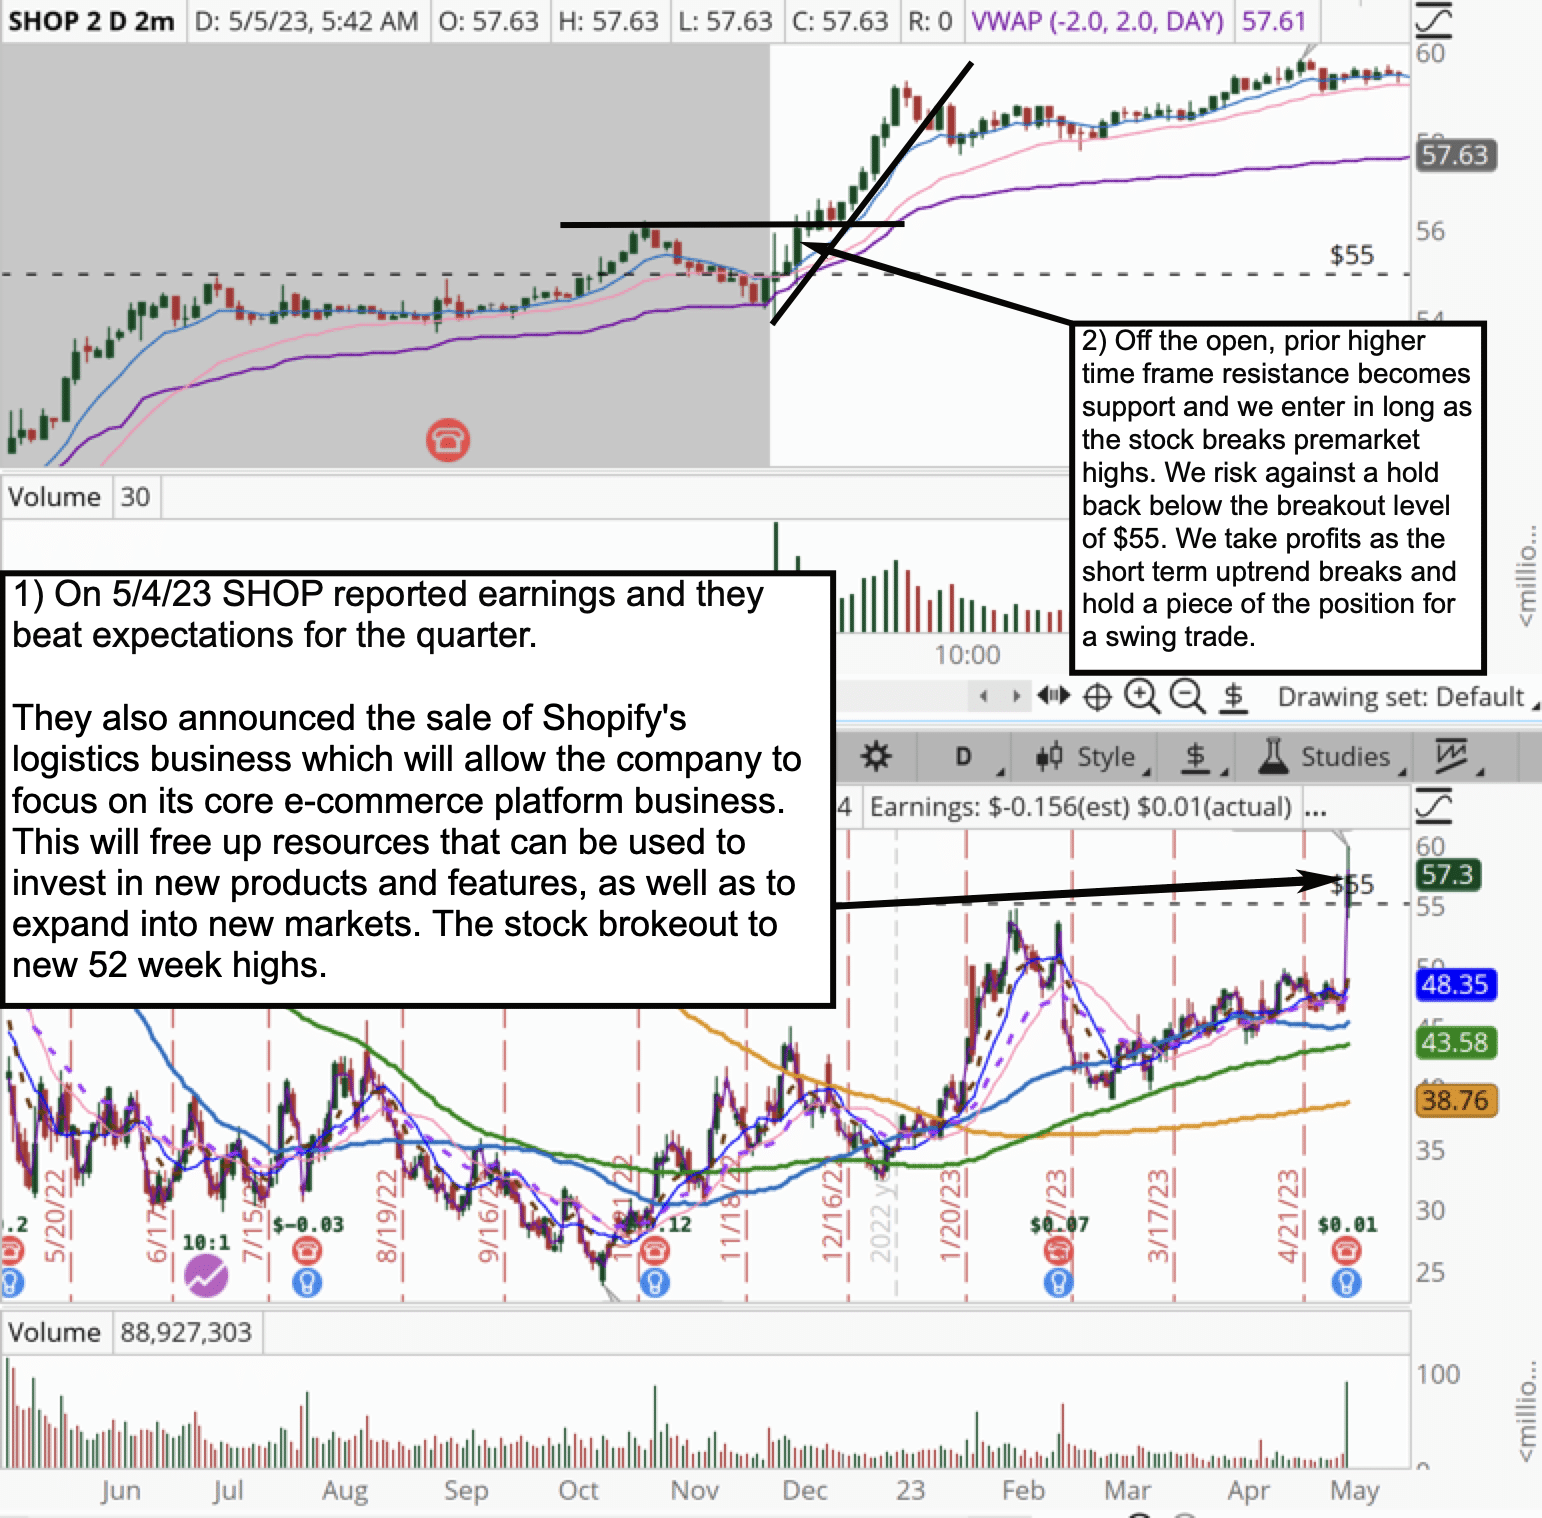
#12 $SHOP
*Please note that the prices and other statistics on this page are hypothetical, and do not reflect the impact, if any, of certain market factors such as liquidity, slippage and commissions.
This is an example of a News Catalyst.
We score this news catalyst as a 9/10. The company has beaten expectations and decided to focus on what they do best and expand.
SHOP is a liquid stock. It met our range criteria for a Stock In Play. RVOL was greater than 3 at the time of the trade.
Similar to the $FSLR trade we discussed earlier (#10), this is another example of an opportunity where prominent players on Wall Street are compelled to increase their stock holdings due to an unexpected positive development.
In this case, Shopify made the strategic decision to divest its logistics business and focus on its core e-commerce operations. This move was encouraging, mainly because the logistics business had been underperforming and weighing down the company’s overall performance.
As a bonus…
Now, let’s explore how day traders can seize this opportunity. When we have a higher time frame breakout combined with exceptionally positive news, a simple yet effective trade strategy is to enter the trade by buying the break of the premarket highs (See the chart above).
In this scenario, the stock broke its premarket high on significant volume and held above that level for a duration of six minutes. This confirmation of strength should bolster confidence in your trade idea and provide a new price level to adjust your stop-loss order as the price lifts off this newfound support and resumes its uptrend.
$SHOP could continue to offer great day trading opportunities for the following reasons:
- The company is well-positioned in the growing e-commerce market. The e-commerce market is expected to continue to grow in the coming years, and SHOP is well-positioned to capitalize on this growth.
- The company is a leading provider of e-commerce solutions, and it has a strong brand and a loyal customer base.
- The company is focused on its core business. SHOP recently sold its logistics business to focus on its core e-commerce business. This will allow the company to focus its resources on its most profitable area, which could lead to increased growth and profitability in the future.
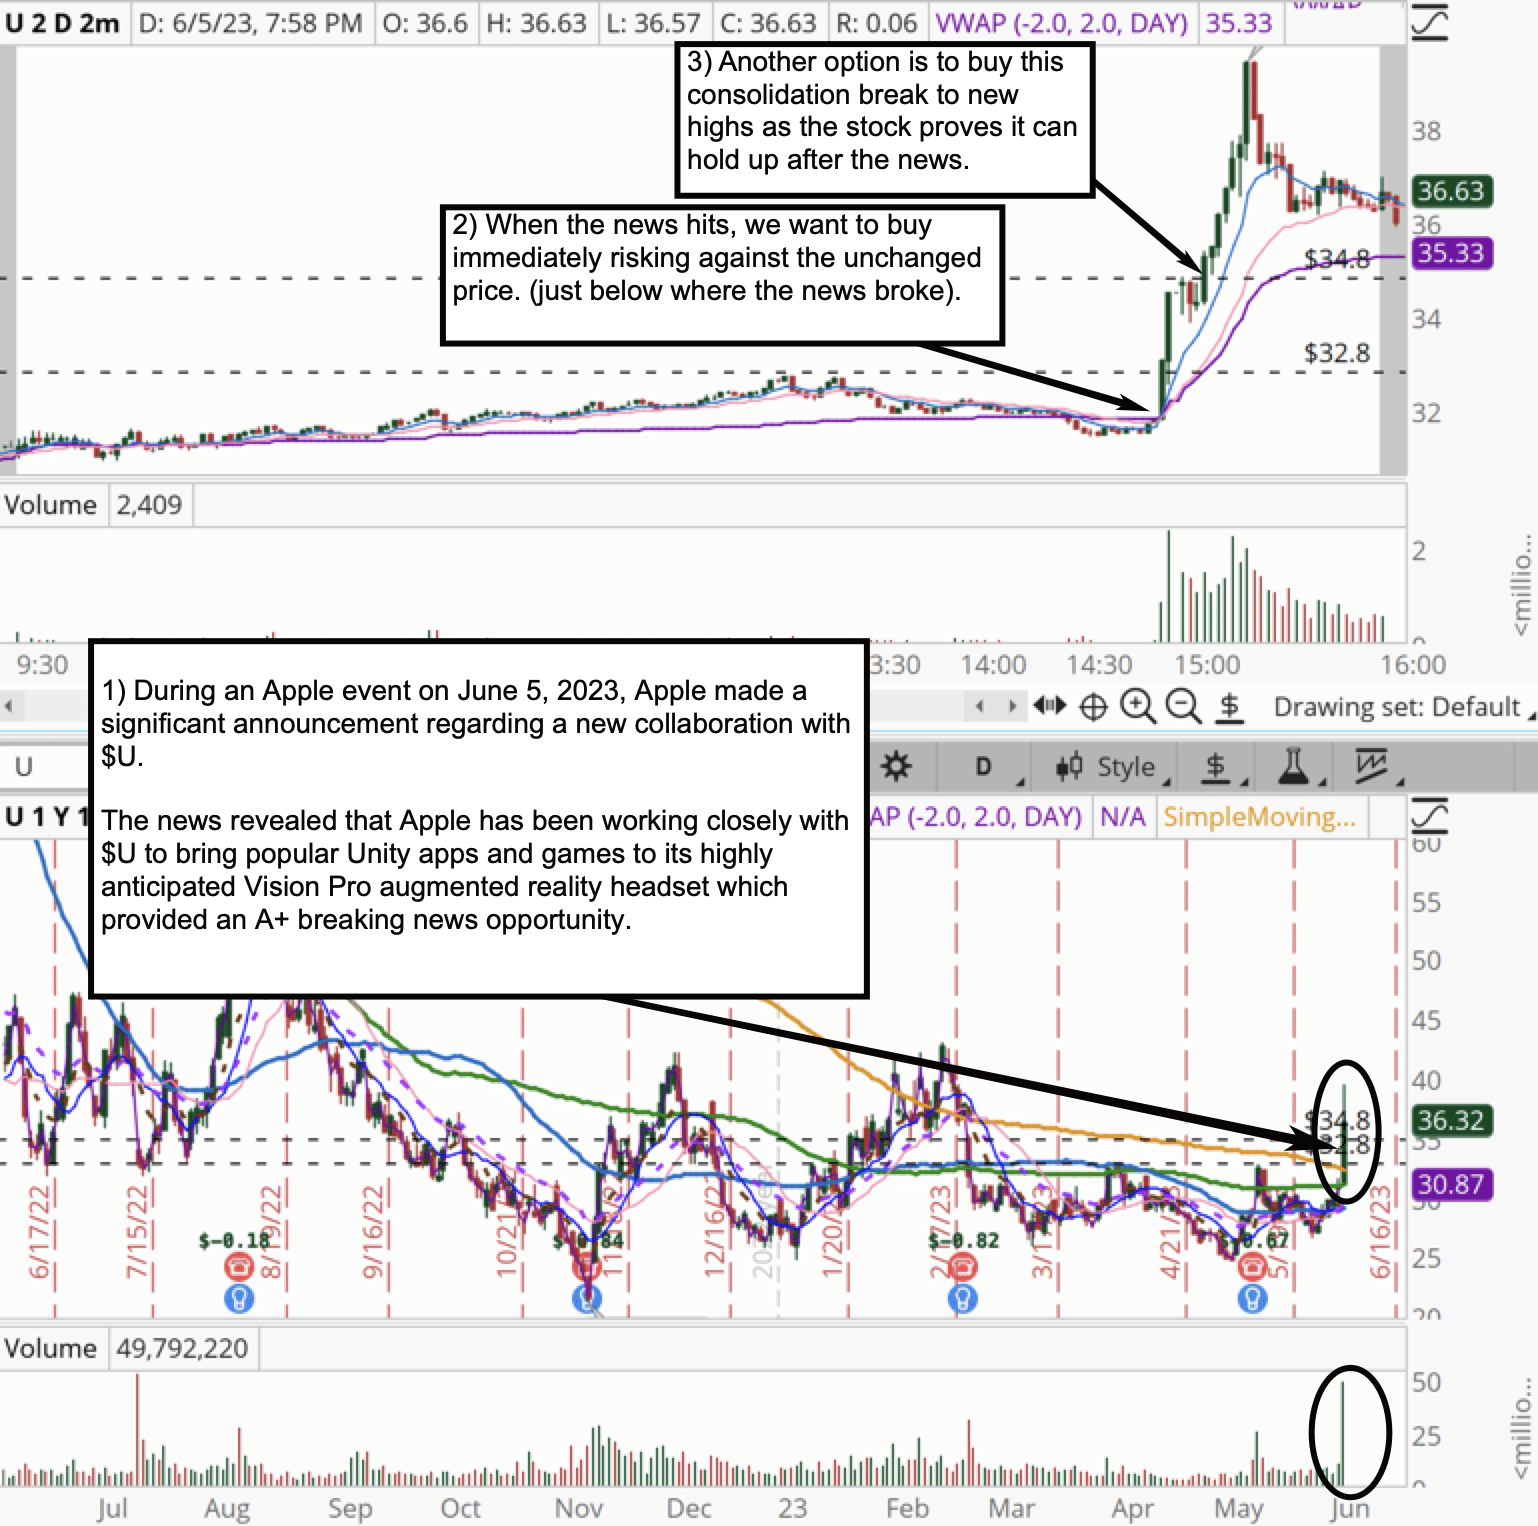
#13 $U
*Please note that the prices and other statistics on this page are hypothetical, and do not reflect the impact, if any, of certain market factors such as liquidity, slippage and commissions.
This is an example of a news catalyst.
We score this catalyst as a 9.
$U is liquid. It met our range criteria for a Stock In Play. RVOL was greater than 3 at the time of the trade.
Here is an example of a breaking news trade in U, which presented a 7-point move. The news broke that Apple has been collaborating with $U to bring games and apps to their new Vision Pro AR Headset. What I want to emphasize about this trade is the advantage of listening to the Live Apple Event. By hearing the news directly from the presenter, you gain a time edge compared to receiving the news from a third-party source, saving precious seconds. In day trading, those few seconds can translate into thousands of dollars.
As a bonus…
Now, let’s explore the trade strategy. We have two entry opportunities in this case. The first approach involves buying the news within the first minute, with a risk level set at the ‘undisturbed price’ as discussed in our example #2, the AMD breaking news trade. However, it is crucial to avoid hesitating and then ‘chasing’ the trade when it has already moved significantly away from the undisturbed price. Chasing a trade often occurs due to FOMO (fear of missing out). Professional traders exercise patience and wait for clear trade setups and levels to manage risk effectively.
In this scenario, it is favorable to wait for a pullback or consolidation before entering the trade. This is precisely what we see at point #3 on the chart. The breakout from that small consolidation offers a clear risk-reward profile and a valid trade setup. By waiting for such a setup, traders can increase the likelihood of a successful trade and mitigate the risk associated with chasing trades.
We’re continuing to watch $U for day trading opportunities due to the following:
- Strong growth prospects: Unity is a leader in the RT3D market, which is growing fast.
- Partnerships with major players: Unity has partnerships with big tech companies, which gives it access to new markets.
- Strong financial performance: Unity is profitable and its revenue is growing.
Additional factors: The gaming industry is growing, AR/VR is becoming more popular, and Unity is expanding into new markets.
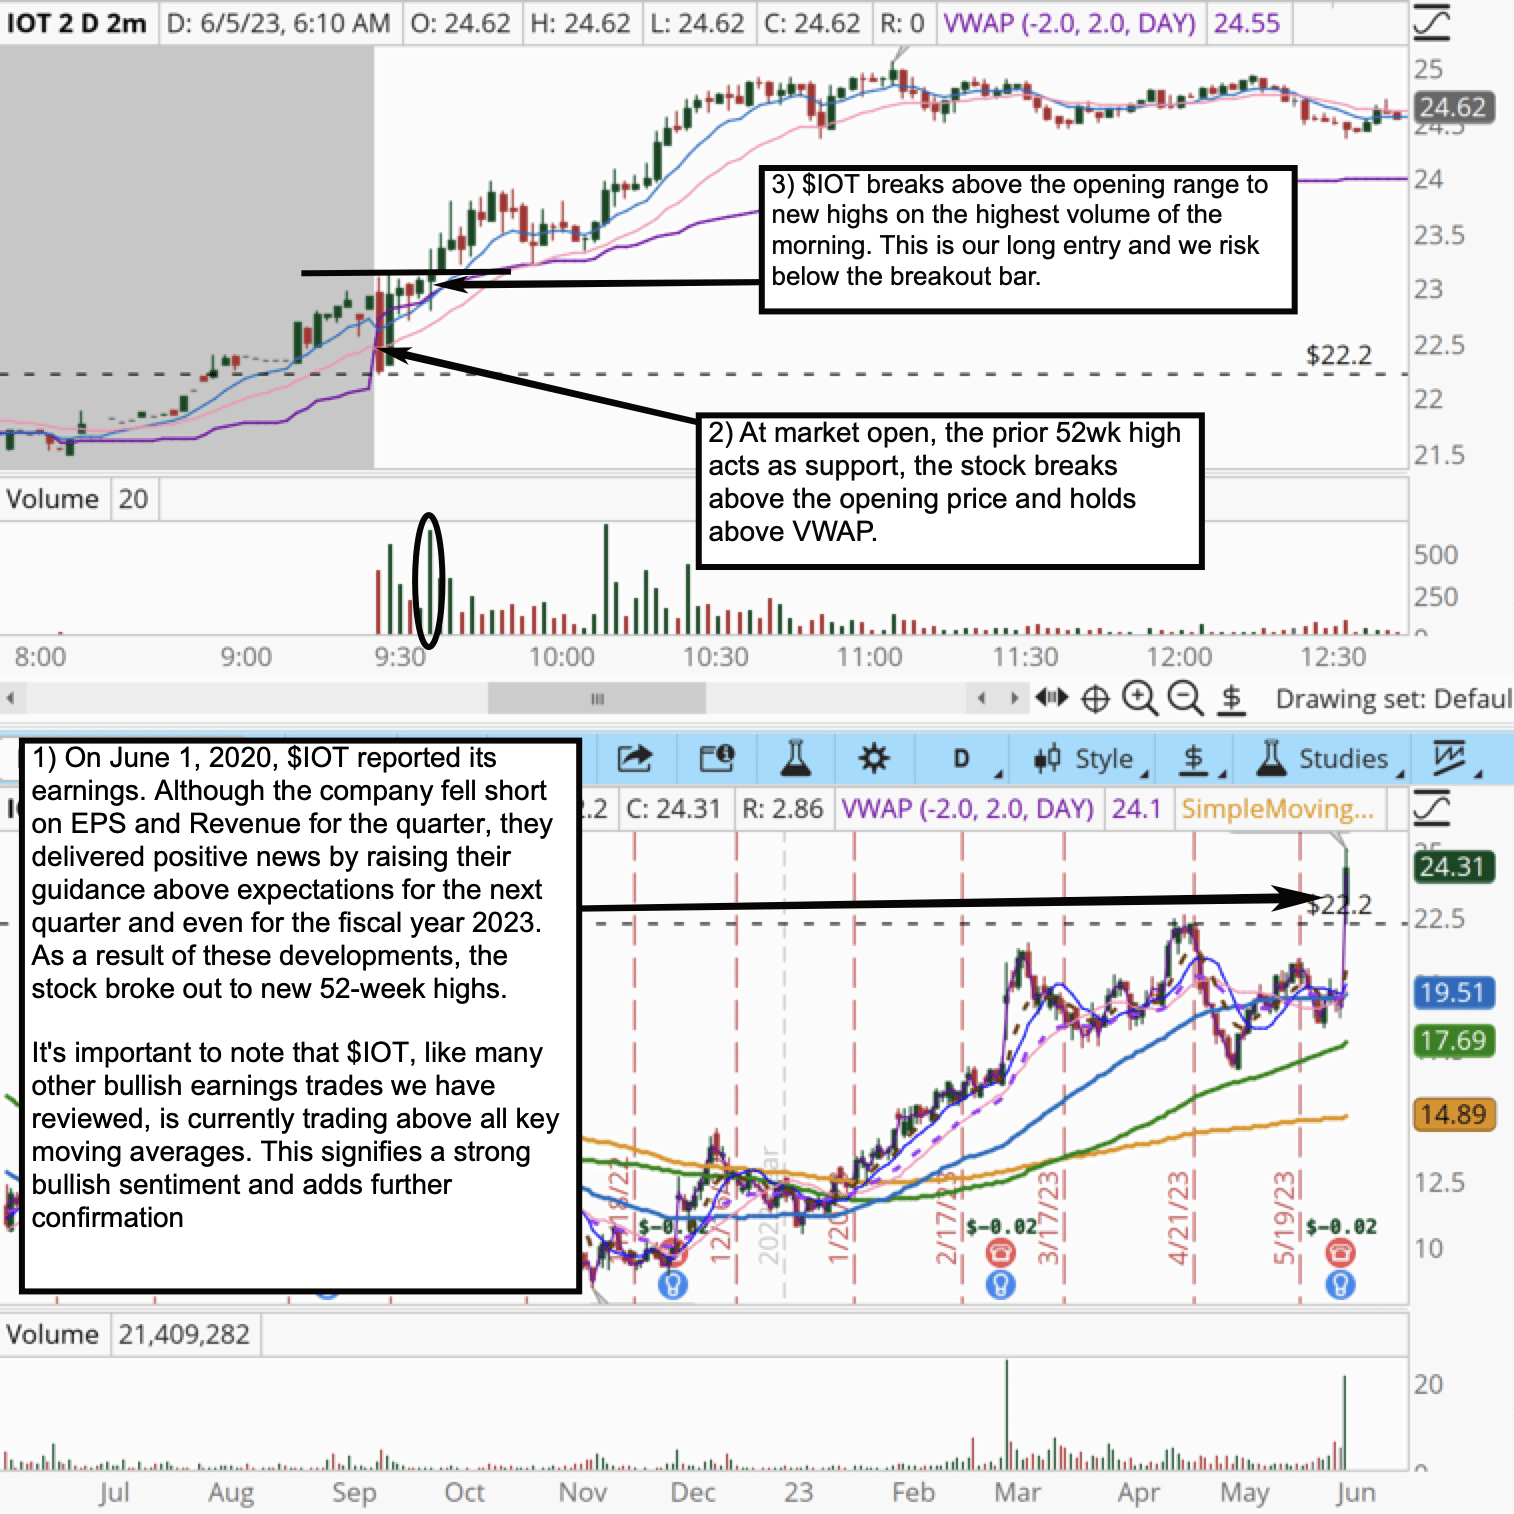
#14 $IOT
*Please note that the prices and other statistics on this page are hypothetical, and do not reflect the impact, if any, of certain market factors such as liquidity, slippage and commissions.
This is a news catalyst.
We score this catalyst as a 9.
$IOT is liquid. It met our range criteria for a Stock In Play. RVOL was greater than 3 at the time of the trade.
As a bonus…
If you’ve been paying close attention, you’ll notice that this $IOT earnings trade incorporates elements from multiple intraday setups we have previously discussed. Let’s dive into these key components that contribute to the strength of this trade.
Firstly, we have the hold of higher time frame support, where the stock puts in a low at a level that had previously acted as resistance and gives us a strong push off of it on volume. This shift demonstrates a significant change in market sentiment, with prior resistance now transformed into support.
Additionally, we witness the break above the opening price, indicating that traders and investors are confirming the stock’s upward movement by driving it into positive territory for the day. This confirmation reinforces the bullish case for the trade.
Moreover, we observe the breakout above the premarket highs, which acts as a critical threshold triggering increased buying interest. Notably, this breakout is accompanied by elevated volume and Relative Volume (RVOL), indicating heightened trading activity and increased participation. The surge in volume further supports the strength of the breakout and provides validation for the trade idea.
Furthermore, the strength of the buying pressure is evident as the stock holds above the Volume Weighted Average Price (VWAP) and key Exponential Moving Averages (EMAs). This signifies sustained demand and reinforces the bullish sentiment, acting as additional confirmation for the trade.
By incorporating these various intraday setups into the analysis of this $IOT earnings trade, and considering the elevated volume and RVOL, we identify the accumulation of positive factors, or what we like to call ‘checks in favor,’ that enhance the trade’s potential. The hold of higher time frame support, a break above the opening price, a breakout of premarket highs accompanied by elevated volume and RVOL, and the strength of buying pressure all contribute to a robust trade setup that day traders can capitalize on.
- The IoT market is growing.
- The IoT market is expected to grow significantly in the coming years.
- Samsara provides a suite of IoT solutions that help businesses to track and manage their assets and operations.
- Samsara has a growing customer base.
- Samsara’s customer base is growing rapidly.
- The company has a strong pipeline of new customers.
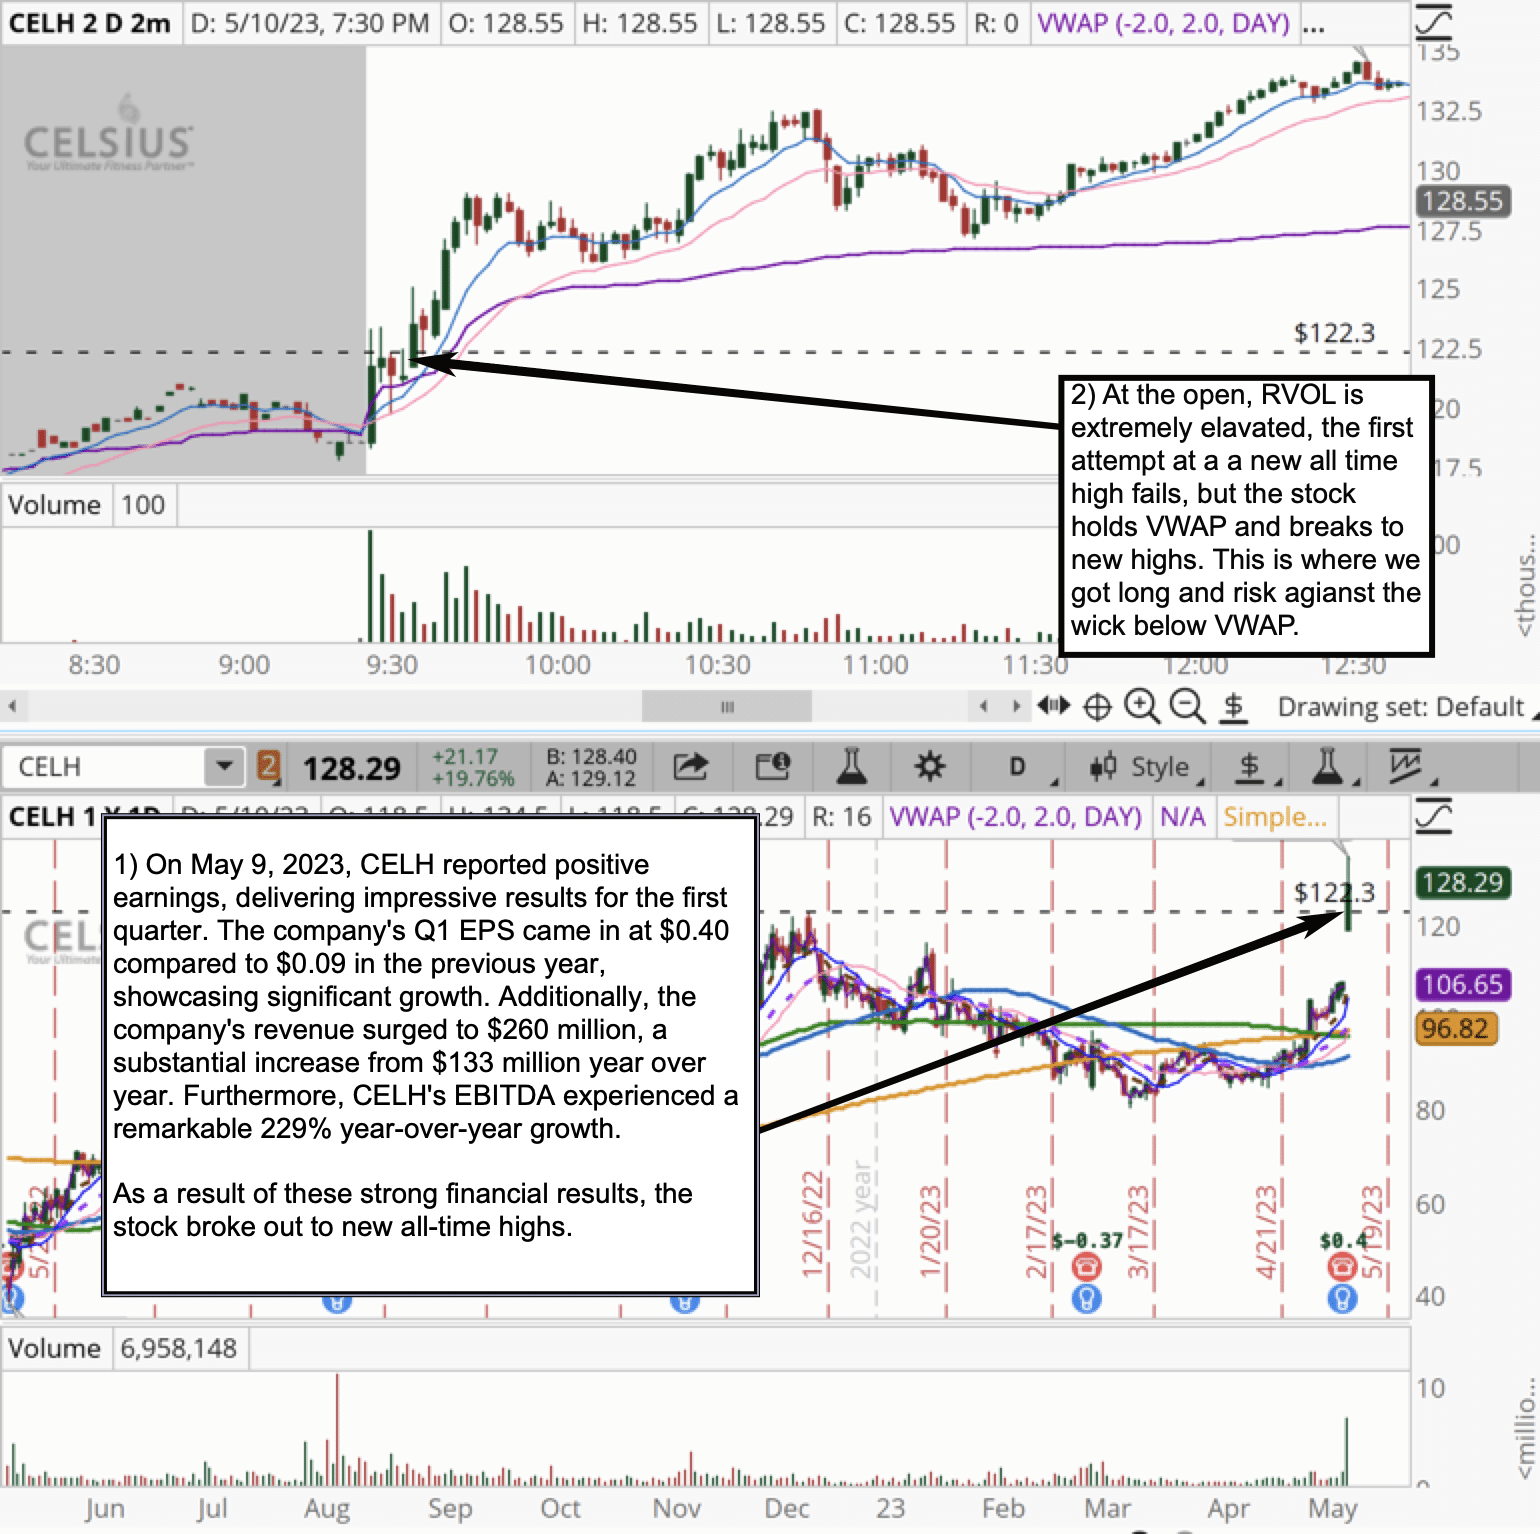
#15 $CELH
*Please note that the prices and other statistics on this page are hypothetical, and do not reflect the impact, if any, of certain market factors such as liquidity, slippage and commissions.
This is an example of a news catalyst.
We score this catalyst as 10. See the chart above on its remarkable earnings.
CELH is liquid. It met our range criteria for a Stock In Play. RVOL was greater than 3 at the time of the trade.
As a bonus, please see the chart above where we mark up the trade you could make with this catalyst.
Our last example, $CELH, and our previous example, $IOT, share numerous commonalities contributing to their appeal as day trading stocks and opportunities. By examining these examples, you should now have a solid understanding of what constitutes an outstanding day trading stock and maybe more importantly, the key elements to look for in intraday trading patterns.
Both $CELH and $IOT demonstrate the importance of identifying significant catalysts, such as positive news developments or fundamental shifts, that can act as triggers for price movements. In both cases, the stocks experienced notable breakouts, confirming the strength of their respective bullish trends.
By analyzing the similarities and lessons learned from these examples, you can develop a solid foundation for your day trading approach and be better equipped to identify and capitalize on potential trading opportunities in the future.
We think $CELH will continue to present solid trading opportunities from earnings reports for the following reasons:
- Rapid growth: Celsius’s revenue grew 62% year-over-year in the most recent quarter.
- Strong distribution network: Celsius’s products are sold in over 50,000 retail locations across the United States.
- Strong management team: CEO Jason Goldman has a proven track record in the beverage industry.
Final Thoughts on Stock Selection
You need to be in the right stocks to pull consistent profits from the market. This article has given you a blueprint to start finding these powerful stocks. To find Stocks In Play, as we say at SMB Capital.
Now you are armed with the knowledge to find the best stocks.
As a veteran trader, I know the substantial difference this makes for a trader. I know the substantial difference this will make for your trading PnL.
This is the difference between being in a trade and not feeling confident you are in the right stock. You are stressed and worried if you are doing the right thing with your money.
Versus…being in a trade and knowing and feeling confident that you are in a good stock to trade. That this stock is worth trading. That your attention is in the right place.
This is a major improvement to your trading. No matter the outcome of your trade, you are in the right stock.
This is a terrific feeling when sitting at your trading station. You now know the best stocks to trade. You now know the best stocks that professional traders trade.
FAQs
- What’s the best way to move forward with day trading?
The best way, by far, is to learn from those who are already consistently profitable. There are many traders online who will claim to be professional traders who can teach you, but there are very few professional trading firms who have stood the test of time and grown numerous 7 and even 8 figure- per-year traders.
SMB can teach you how to day trade successfully: Join us for free at TradingWorkshop.com.
- Can you get rich by day trading stocks?
You can. There are day traders on our trading desk who have made seven figures and even eight figures a year trading. These traders were first trained by our firm. They learned numerous day trading strategies that they developed. Over time, they built skills to pull consistent profits from the market. They have firm resources like capital, technology, coaching, and mentoring to help them reach their potential.
- How much money do you need to get started day trading?
You can start with a few grand and seek consistency. Trade selectively and focus on only a few setups that have an edge. Build from your success.
If you build consistency and are ready to day trade for a living, then have at least $50k and two years of living expenses in the bank. Or apply to a prop trading firm, like SMB Capital, to trade firm capital.
- What are the risks associated with day trading stocks?
You could lose all the money in your trading account. Please make sure you are properly trained before you start trading live. Consider trading on a simulator and proving your edge to yourself before risking your capital in the market.
We ask our traders to set risk limits for each trade, day, week, month, and strategy. These guardrails protect traders when they are not trading well. Traders must respect these risk limits. You should as well.
- What are some effective day trading strategies?
Mike Bellafiore, Co-Founder of SMB Capital, tackled this topic in an extensive article he wrote The Only Day Trading Guide a Beginner Will Ever Need (The Basics from A to Z). For a taste of the more frequently used day trading strategies see a section of that article Day Trading Strategies.
Jeff Holden, Head of Recruiting at SMB Capital, also wrote an article on scalping, an effective trading strategy many day traders deploy. Please read Scalping 101: All You Need to Know to Get Started With Scalp Trading (Practical Knowledge Directly from a Tier 1 Prop Firm).
And If you want to get a major head start and accelerate your learning curve much faster, you can also attend our free, intensive trading workshop, where we’ll teach you the exact ins and outs (in step-by-step detail) of 3 of our top-performing trading strategies (and much more). You’ll learn the specific rules of entry and exit in far more detail than we can provide in one article. These are the exact strategies our 7 and even 8-figure-a-year day traders use day in and day out. Reserve your free seat here.