Can you make money trading?
What does it take to make consistent profits?
What is the absolute best way to get started?
If you’re a beginner trader or just looking to get started, you’re likely asking these questions. And you should be. I know how it feels. There is no established road-map to becoming a successful trader, so it can be difficult to know where to begin.
At one point, indeed not too long ago, I was in your shoes. I didn’t understand the basics of trading. Heck, I didn’t even know what “the tape” was, something I now watch every single day. I had to dig to find what I truly needed to become a trader. And fortunately, I had the help of SMB Capital, which has built its firm teaching new traders the fundamentals of trading and the steps to take in order to become successful.
So if you’re asking these questions, this article was written for you.
For over a century, people from all walks of life have dedicated their lives to generating profits from the Stock Market. Much has changed over the years in terms of technology and the way traders operate, but the fundamental truths about supply and demand remain the same.
Recent events like the GameStop stock saga along with the surge in AI-driven technology have sparked a growing interest in stock trading, making this a timely subject to explore.
Navigating this world takes great skill. Fortunately for us, these are skills that can be taught. Whether you’re starting with a small savings account, a significant investment, or striving to earn a spot on a professional trading desk, everyone begins at the same place – the basics.
I’m a senior trader at a proprietary trading firm in New York City. In fact, it is one of the longest lasting and most successful proprietary trading firms out there. I trade discretionary strategies as well as develop algorithmic trading systems for the firm.
You can follow me on Twitter @GarrettDrinon.
I will lay out in this article what I know about getting started, so that you don’t have to dig like I did. And if you notice that we return to certain topics a number of times, it’s because there are particular things about trading that are just that important. We want to drive them home. In this article we’ll cover:
-
Trading Terminology
-
What is Stock Trading?
-
Understanding Stocks
-
The Stock Market
-
Where to Trade Stocks
-
Types of Stock Trading
-
How to Trade Stocks
-
Risks and Rewards of Stock Trading
-
Technical Analysis
-
Fundamental Analysis
-
What You Need To Become Successful
-
The Ingredients of a Profitable Strategy
-
Specific Trading Strategies
-
FAQs
-
Wrap Up
… so let’s get started!
Trading Terminology
Just like in any other medium, stock trading has its own language. So let’s break down some of this terminology so that you can sit on a trading floor and know exactly what these people are talking about.
It’s quite simple once it’s laid out for you. And if you don’t get it at first, that’s okay – we will go into greater detail on many of these topics later in the article. Here are a dozen of the most important terms a trader uses on a daily basis:
1. Stock: Also known as shares or equity, a stock is a type of investment that represents ownership share in a company. When you buy a stock, you are purchasing a piece of the company.
2. Market Capitalization: This is the total market value of a company’s outstanding shares of a stock. It’s calculated by multiplying the company’s shares by the current market price of one share. Companies with a high market capitalization are often referred to as large caps; those with medium market capitalization are referred to as mid caps, and those with small market capitalizations are referred to as small caps.
3. Bull Market / Bear Market: A bull market refers to a market condition where prices are rising, and widespread optimism often sustains the upward trend. Conversely, a bear market refers to a market condition where prices are falling, and widespread pessimism often sustains the downward trend.
4. Bid and Ask: A bid is an order to buy shares of a stock at a certain price. An ask (also known as an “offer”) is an order to sell shares of a stock at a certain price. Just like at an auction, the highest bid and the lowest ask represent the inside market where most of the business is being done.
5. Spread: This is the difference between the highest bid price and the lowest ask price. It represents a cost associated with trading. With wider spreads, traders are required to pay more to exit their position immediately.
6. Volume: This is the number of shares of a security traded during a given period of time. High volume often suggests high interest in a particular stock.
7. Liquidity: This refers to how easily a stock can be bought or sold without impacting its price. High liquidity means the stock can be traded easily, and vice versa. A tight spread and high volume are two factors that can contribute to high liquidity. A wide spread and low volume are two factors that can contribute to low liquidity.
8. Volatility: This refers to the price movements of a stock or the stock market as a whole. More specifically, volatility is the magnitude of price moves per unit of time. Highly volatile stocks are ones with extreme up and down movements and wide intraday trading ranges.
9. Fundamental Analysis: This is the evaluation of anything related to the company itself or overall market narratives. A fundamental analyst studies a company’s financials, industry, and general economic factors to draw a conclusion about the stock and make trading decisions.
10. Technical Analysis: This is the evaluation of anything related to the actual trading activity of the stock or movement of the overall market. A technical analyst studies statistical trends in price movement and volume and uses charts as a key tool.
11. Stop-Loss Order: This is an order placed with a broker to buy or sell a stock when it reaches a certain price. It’s designed to limit a loss on a position.
12. Long and Short Positions: In trading, if you’re “long” a stock it means you’ve initiated a position by buying the stock with the expectation that the price will go up in order to sell at higher prices. Conversely, if you’re “short” it means you’ve initiated a position by selling the stock with the expectations that the price will go down in order to buy back the stock at lower prices. At first, the idea of selling a stock to make a profit can seem a little backwards, but we will cover the concept of short-selling in more detail later in this guide, and it will become second nature in no time.
What is Stock Trading?
Have you ever seen news stories of stock prices going up and down and wondered how people make money from these movements? It’s an activity that requires strategy, tactics and an understanding of market dynamics.
Simply put, stock trading is the buying and selling of shares in publicly listed companies. Traders aim to profit from the fluctuations in stock prices by buying at lower prices and selling at higher prices.
There are two types of positions a trader can initiate: long and short positions.
Traders can get long a stock by initiating a buy order, looking to profit from a price increase by selling the stock. To visualize this, imagine going to a garage sale and finding a baseball card of your favorite player. Projecting this player will have a great season, you buy the card with the idea that you have a high probability of selling the card at a higher price to collectors online in a few months.
Conversely, traders can get short a stock by initiating a sell order, looking to profit from a price decrease by buying back the stock, which is called “covering” your position. This may seem strange at first – how can you sell something you don’t own? Well, short selling is made possible by the act of borrowing shares before selling them and then returning them to their rightful owner after buying back the shares.
To put short selling into context, imagine borrowing your friend’s rare comic book and selling it to a buyer. Later, you find the same comic book at a discounted price, buy it, and return it to your friend. The difference between your selling and buying prices is your profit. With stock trading, in our modern age, this process is streamlined – it’s all done with the click of a button.
The act of buying and selling is only the tip of the iceberg. In order to have a shot at becoming profitable over the course of many trades, we must first understand what to buy and sell, and what makes these stocks move.
Understanding Stocks
What is a stock?
When I buy a stock, do I really own anything?
Stocks represent a fraction of ownership in a company. When you buy a stock, you do in fact own a portion of the company.
Imagine you’ve opened a lemonade stand. By issuing stocks, you’re essentially inviting people to buy small parts of your lemonade business. These shareholders now have a stake in your lemonade stand’s success, just as you do.
As a shareholder, there are two ways that you can see returns on your investment: dividends and capital gains.
Dividends are generated from companies sharing a portion of their profits with shareholders as a “thank-you” for their investment. Dividends are a steady stream of income, relevant mostly to investors and long term holders of a stock.
Capital Gains are generated from selling stocks at a higher price than you paid. Active traders focus mostly on generating income from capital gains, as this is what trading is all about, capitalizing on the fluctuations in the stock price.
A company’s performance influences its stock price. If your lemonade stand starts selling the most delicious lemonade in town and profits soar, those who own your stock will likely see their value increase. On the other hand, if your lemonade starts tasting bitter and people stop drinking it, the value of your stocks might drop. These earnings are reported quarterly to the public.
Ultimately, and this is very important to remember – the price movement of a stock depends on the supply and demand dynamic present in the market. If demand for a stock is overwhelming supply, the price will rise and if supply is overwhelming demand, price will fall. This is a fact. Just as your Uber ride price will go up when it’s raining because now everybody wants to call a car, a stock price will go up if everyone wants to buy it.
Have you ever watched the news and heard the reporter rave about a company’s earnings only to see the stock tank the next day?
This is when it’s crucial to remember the supply and demand dynamic at play. If a very large player wants out of a stock, there doesn’t need to be a fundamental reason or news story behind the move. If there is selling pressure, the stock will go down.
As traders, we use this dynamic to our advantage. We learn to read the buying and selling pressure and we love volatility because it helps us make money.
The Stock Market
If you want to buy and sell something, you need a marketplace. The stock market acts as a marketplace for buyers and sellers of stocks, very similar to an auction house.
Just as you might bid for a precious piece of art or a vintage car at an auction, traders bid for stocks. The trading of these stocks is facilitated by exchanges such as the New York Stock Exchange and the NASDAQ, which list the stocks of thousands of companies.
Have you ever been mystified by the hundreds of tickers flashing on financial news channels and wondered, how can I follow all this chaos?
Well, we can group stocks into broad market averages in order to easily digest all this information.
To do this, we look to indices like the Dow Jones Industrial Average, S&P 500, NASDAQ 100, and the Russell 2000 which offer snapshots of the market’s performance. They track a selection of companies, each with a different focus.
Think of these indices as the stock market’s pulse, vital barometers of overall health and economic trends. If these indices are on the rise, the economy is often seen as doing well. If they are falling, it might suggest economic downturns.
The Dow Jones Industrial Average, traditionally referred to as “the Dow”, is made up of 30 of the largest publicly owned U.S. companies. Think of the Dow as the highlight reel, representing a sample of some of the biggest and most influential companies in the U.S. We can trade this index via the ticker DIA.
The S&P 500 includes 500 of the largest U.S. companies across various sectors, offering a comprehensive snapshot of the U.S. economy’s health. Due to its focus on a wide range of industries and large market capitalization, the S&P is often seen as the most accurate representation of the U.S. stock market as a whole. We can trade this index via the ticker SPY.
The NASDAQ 100 includes 100 of the largest domestic and international non-financial companies listed on the NASDAQ exchange. With technology making up a significant portion of its roster, this index serves as a reliable barometer of the tech sector’s performance. It’s worth noting that a stock can be listed on multiple indices simultaneously. For instance, Apple features on the Dow, the S&P and the NASDAQ 100. We can trade this index via the ticker QQQ.
The Russell 2000 Index, unlike its counterparts, hones in on 2000 smaller, up-and-coming U.S. companies. Because these small capitalization companies are often riskier investments, the Russell is often seen as a barometer for speculation and risk appetite within the stock market. We can trade this index via the ticker IWM.
Where to Trade Stocks
This is a topic that I get tons of questions about. As a new trader, there are so many options between brokerages and trading platforms that it can be overwhelming.
But rest assured, this is something that will become very comfortable once you examine the options. And remember, you can always experiment with various platforms before you settle on one.
Stock trading can take place through several avenues:
Online brokers will help you set up a trading account and they offer platforms with tools for independent trade management, such as charts and watchlists. Here are a few popular online brokers that many traders use:
- ThinkorSwim
- TradeStation
- Interactive Brokers
- E-Trade
- Robinhood
Trading fees are a key component. Trade execution, short locates, margin interest, and other fees will all be specific to the broker you choose. As you gain experience you may seek out brokers for high volume, active, advanced day traders such as:
- Lightspeed
- CenterPoint Securities
- Cobra Trading
- SpeedTrader
Full-service brokerage firms, on the other hand, offer a suite of comprehensive services including personalized investment advice and portfolio management, but may not not provide the features that an active trader is looking for.. A few popular full-service brokerage firms include:
- Fidelity
- UBS
- Morgan Stanley
- JP Morgan Wealth Management
- Charles Schwab
Each option carries its own set of pros and cons concerning cost, services, and the degree of control you have over your investments.
Charting software packages offer charting and research tools without the ability to place trades. You may want to investigate other charting options or you may seek more advanced trading tools after you gain experience. This is where stand-alone charting software can come into play. A few popular options include:
- TradingView
- TC2000
- eSignal
- Stockcharts.com
- MarketSmith
- Bloomberg
Just because a company charges a fee for a stand-alone charting platform does not mean it’s necessarily better than a platform that comes with an online broker account, such as ThinkorSwim or Tradestation. Many online brokers and charting software packages offer fantastic charts, indicators, custom scripting, watchlists, stock alerts, and financial analysis.
Ultimately, your choice should align with your trading goals, style, and your desired level of involvement.
At SMB Capital, we utilize our own proprietary trading platform and tools to manage trades, conduct research, and develop algorithmic trading strategies. Some traders supplement these tools with charting platforms from ThinkorSwim, TradeStation, TradingView or TC2000s to name a few.
There are plenty of free options out there that offer more than adequate resources.
By the way, if you’re really interested in getting into stock trading, we’re currently running a free online training where you’ll discover:
- The simple high probability trading strategy that we teach all new traders on our desk (this alone could make you a profitable day trader)
- One of our firm’s most profitable and consistent proprietary trade setups (you won’t see this anywhere else)
- The unique strategy that turned one of our traders into a 7-figure elite trader (which is surprisingly easy to learn and execute)
- How to get funded with large risk capital and trade our money with ZERO risk to you (all from your own home)
Reserve your free spot now. (If you’re a complete beginner, make sure to read this article before attending, so you’re completely up to speed and can quickly and efficiently learn the strategies we teach).
How to Trade Stocks
So you understand the different types of brokerages and charting platforms; you’ve done your research and decided to try one out that makes sense to you. You might be asking yourself, how do I make a trade?
These brokerage accounts are like your personal command center, giving you control over your trades. Here, you can place different types of orders:
Market Orders: These orders execute immediately at the best available price. Think back to the auction analogy. If someone is bidding for the stock at 60 dollars, you can take that bid to buy the stock at 60 dollars by placing a market order.
The key thing to understand with a market order is that when you place the order, there is no limit to the exact bid that you will actually take. If liquidity is low or the bid drops to a lower price, the broker will fill you at whatever the best available bid is, regardless of price. This is the fastest way to buy or sell a stock because you are guaranteed to get filled, but you are subject to the liquidity level of the market.
Limit Orders: These orders set a specific price at which you are willing to buy or sell the stock. Unlike market orders that execute immediately at the best available price, limit orders only fill when the stock hits your predetermined price or better.
For example, if you want to buy a stock, but not for more than 50 dollars, you would place a limit order at 50 dollars. In our auction analogy, your order will become a bid at 50 dollars. This type of order is not guaranteed to execute, but when it does, you are assured of getting filled at 50 dollars or better.
Stop Orders (or Stop-Loss Orders): These orders trigger a market order to buy or sell a stock once it hits a certain price, called the stop price. For instance, if you are long a stock currently priced at 40 dollars, and you want to limit your potential loss to 5 dollars per share, you could place a stop order at 35 dollars. If the stock falls trades below 35 dollars, your stop order becomes a market order to sell, getting you out of the position.
However, if the stock’s price falls rapidly past your stop price, the actual selling price could be lower – because remember, in this case, your order becomes a market order where there is no limit to the price at which you get filled.
Stop-Limit Orders: These orders are a combination of stop orders and limit orders. Once the stop price is reached, the stop-limit order becomes a limit order to buy or sell at a specified price or better. This gives you more control over the price at which the trade is executed, but just as in a normal limit order, there’s the risk that the order may not fill at all if the stock’s price moves away from the specified limit price after the stop price is hit.
For example, let’s say you set a stop price at 55 dollars with a limit price at 54 dollars. In this case, the order will turn into a limit order once the price trades below 55, filling you anywhere from 55 down to 54, but if the price continues to fall and skips over 54 dollars, the limit order may not execute.
Now that you can visualize the difference types of orders and their effects, think back to our original definition of liquidity:
A highly liquid stock most likely gives you a better chance of getting filled. A highly illiquid stock might require looser limit prices on stops or might cause you to get “slipped” on a market order, which is a term used to describe the instance in which the market moves past your intended execution price.
And remember, just like any business, trading comes with a cost-of-business, which can include commissions and transaction fees, as well as the spread, which as you now know, is the price difference between the highest bid and the lowest ask price. If you pay the ask to get long, the only way you’re guaranteed to exit immediately is by hitting the bid with a market order, so the larger the spread, the more it costs a trader to execute a trade.
If you’re interested in how these specific order types come into play when trading real-world setups, I made a video about it on the SMB Capital YouTube channel.
Types of Stock Trading
Now that you understand the basics of what the stock market is and how we can participate in it, you may be asking yourself…
What kind of trader should I become?
There are various styles of stock trading each tailored to different risk profiles and lifestyle choices. For instance, some styles might suit those who can devote their entire day to trading, while others may be more suitable for those who can only dedicate a few hours each week.
An easy way to break down the different styles is by timeframe, which is a measure of how long a trader is looking to hold a stock position. There are four basic timeframes a trader might employ: intraday trading, swing trading, position trading, and investing. In this article we will focus on the former three types, because investing falls outside the scope of active trading.
Intraday trading is like being a sprinter in a race. An intraday trader enters and closes out a trade all within a single day. These can be scalp trades, which are very quick trades based on short term signals, or they can be move-to-move trades, meant to capitalize on intraday swings in the market.
If you’re interested in learning more about these different types of intraday trades – scalps, move-to-move trades, and trades to hold – I made a video about them here on the SMB Capital YouTube channel.
Because intraday trades are meant to capture short price fluctuations, intraday traders often utilize a large amount of capital, or leverage, in order to execute these trades, and they typically set close stops, meaning they plan to sell the stock if its price drops a small amount, to limit losses.
Due to the quick turnover of trades, intraday trading requires constant attention, quick decision-making skills, and a deep understanding of short-term market movements. Intraday traders are typically required to sit in front of the screen all day.
The most elite intraday traders on our desk possess the ability to process information very quickly.
Swing trading can be thought of as a middle-distance race. A swing trader holds a position for several days or even weeks, aiming to profit on short-term price swings, and often has multiple positions open at once. Traders employing this style need to anticipate market trends and time their moves to optimize profits.
While swing trading doesn’t call for quite as much speed as intraday trading, it demands patience, strategic foresight and a knack for understanding market momentum. A swing trader must still spend much of their time in front of the screen and be constantly aware of their positions.
The top swing traders on our desk possess the ability to multitask and analyze a lot of information at once.
Position trading, on the other hand, is the marathon of stock trading. A position trader holds a position for months or even years, with the aim of profiting from long-term price trends. A position trader typically allows more room for their trade to work and bases their analysis on “big-picture” ideas.
Position trading requires far less screen time and daily attention to price fluctuations. A position trader might not have to watch quotes all day, but they must still find time to develop a sound strategy and recognize quality trading signals.
Top position traders possess the ability to analyze information in a deep and multidimensional way.
Within each of these trading timeframes, a trader can utilize both fundamental and technical analysis to make decisions. And a trader can employ a number of different setups to make trades.
A setup is a statistically repeatable pattern that informs a trader that a trade is on the horizon. We will dive into more detail on trading setups later in this article.
But the best way to learn the top trading setups is to learn them directly from a firm like ours. Why? Because we have 50+ professional traders and we’ve been profiting consistently from the markets for many years, through all kinds of market conditions. Our traders are the real deal, and the strategies they trade have stood the test of time. So head over to TradingWorkshop.com to claim your free spot on our in-depth workshop.
Risks and Rewards of Stock Trading
The risks and rewards of trading could very well be the most important section in this article for a new trader. At its core, stock trading comes down to risk, rewards and probabilities. The combination of these factors is what gives us an edge in the market.
Of course, just like any business, trading stocks does not come without risks. Market volatility can whip the value of a stock back and forth, and in the blink of an eye, potential gains can morph into significant losses if the stock price takes a nosedive.
This is why we trade with safeguards. Savvy traders are in control of their risk and equip themselves with risk management tools like stop orders. And they place these stop orders in strategic levels in order to minimize risk while also giving themselves a high probability of success in the trade.
Some traders set profit targets to help manage their potential returns. A simple way to set a profit target is by placing a limit order to sell the position above the market, at a price at which you would be happy to exit for a profit. Other traders might set trailing stops, which, for a long position, rise along with the stock price to assure that if the stock reverses a meaningful amount, the position is exited at a profit.
So you may be wondering, how do I balance these risks and rewards so that I come out profitable?
Well for one, a strong self-awareness is a key factor in successfully implementing a trading strategy that suits you. You should have a sound understanding of your risk tolerance and your goals.
Sizing your trades is a crucial factor in trading successfully. Your share size and stop level should always reflect how much you are willing to lose on a single trade. Simply multiply your share size by the price difference between your entry and your stop and you have your risk. To get your share size, simply divide your desired risk amount by the price difference between your entry and stop.
This is the kind of math we do in our heads when trading.
Let’s say you buy a stock at 80 and think it can go to 86. You place your stop at 78 because you think it should not trade below 78. You want to risk 100 dollars. Since you have a 2 dollar stop (80 – 78 = 2) you now know that you can buy 50 shares at 80 to risk 100 dollars (100 / 2 = 50). And now you know that, with a 6 dollar target, if the stock trades to 86, your reward will be 300 dollars (50 x 6 = 300).
In the above example, this 3 to 1 (risking 100 to make 300) relationship between reward and risk is something traders will focus on. Let’s define two key terms:
Profit-Loss Ratio: This is a measure that compares the average profit of a trading system to its average loss. For instance, if on average we either lose 50 or make 100, our profit-loss ratio will be 2 to 1. In other words, our average winner is 2 times the size of our average loser.
Win Rate: This is a measure of the number of profitable trades relative to the total number of trades. It’s expressed as a percentage. For example, if a trader makes 100 trades and wins 60 of them, their win rate would be 60%.
If your profit-loss ratio is very high, you can afford to lose more often. Think about it, if you’re realizing a 3 to 1 profit-loss ratio on your trades, you only need to win more than 25% of the time to eek out a small profit, bearing transaction costs. For every 3 times you lose, you need one winner to cover the losses.
On the other hand, If your win rate is very high, you can afford to lose more on your losers than you make on your winners. Imagine you win 68% of the time. Because you are winning more than twice as often as you are losing, you only need a 0.5 to 1 profit-loss ratio in order to eek out a small gain.
This is not an opinion, it’s just math.
The profit-loss ratio and win rate together can determine if a strategy is profitable or not. This is why traders are always thinking about risk, reward, and probabilities when executing and developing strategies.
As a trader demonstrates edge and strong performance in a particular strategy, he or she will incrementally increase the risk, and therefore the share size, in order to grow the strategy. And again, these increments should reflect your understanding of your own risk tolerance and goals.
Alright, now that we’ve laid out the groundwork for trading stocks, let’s dive into some of the tools traders use to gain an advantage in the market.
Technical Analysis
By now you know that technical analysis is the study of any information that comes from historical price movements and volume. This information can come in the form of price patterns, statistical indicators or relative strength and weakness.
Since most technical analysis is centered around price charts, let’s examine how to read a candlestick chart, the most common chart style used by traders.
The Basics of Candlesticks
What is a Candlestick Chart?
The Candlestick Chart is a highly visual tool that is part of almost every trader’s arsenal. Simply put, a Candlestick Chart is a type of price chart. It differs from a traditional line chart in that it offers much more information about price movement.


Above is an intraday chart of SPY. In this example, each candle represents 5 minutes. The chart starts at 9:30 am and ends at 4 pm.
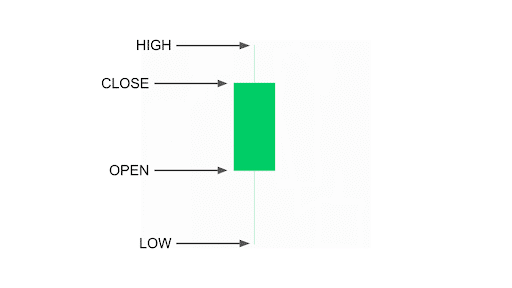
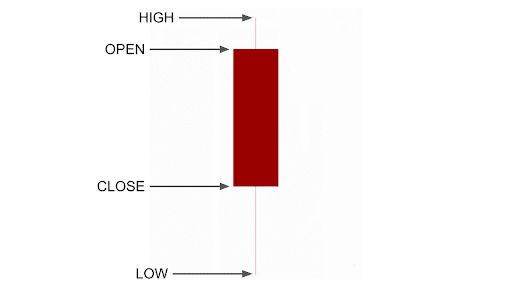
For every candlestick chart, each “candle” represents a specific time interval called the “timeframe”, and illustrates 4 significant price points within its respective timeframe: the open, the high, the low, and the close.
The Anatomy of a Candlestick Chart
Let’s break down a single candle so that we can learn to interpret price action from a Candlestick Chart. Each candle has two major components: the body and the wick.
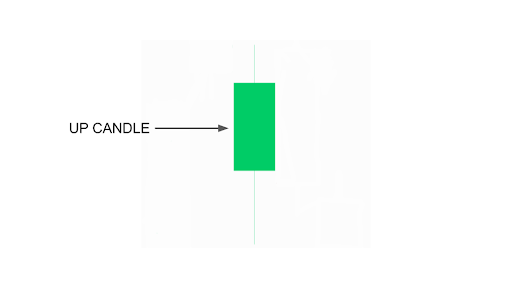
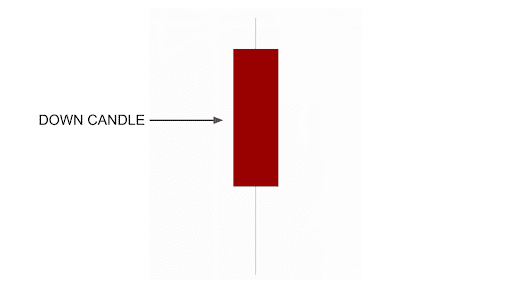
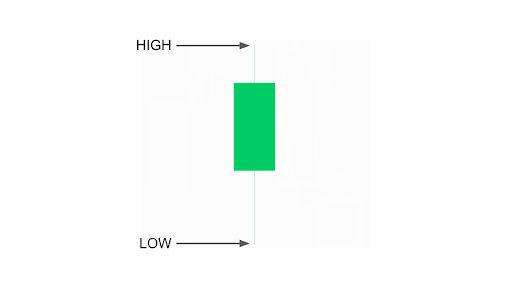
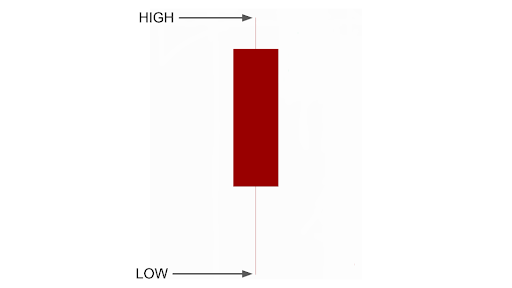
Body: The body of a candle is the rectangular section within the candle. It represents price movement between the open and the close of the candle’s time interval.
To determine the price direction of the candle we must understand the coloring of the body. Most often, an up candle body will be colored green while a down candle body will be colored red. Occasionally, especially when color is not an option, an up candle body will be hollow while a down candle body will be filled-in.
The color designations of the body depend on personal preference, as most charting platforms allow for customization.
Where is the open and close of a candle?
The open is the price at the beginning of a candle’s time interval and the close is the price at the end of a candle’s time interval. Because the body represents net change from open to close, the open and close will be located at each end of the body.
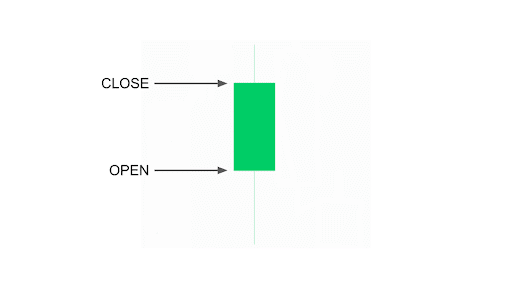
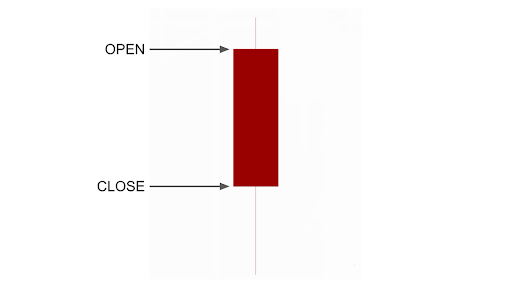
To find the open, pinpoint the bottom of a green body, or the top of a red body. To find the close, pinpoint the top of a green body, or the bottom of a red body.
Wick: The wick of a candle, sometimes referred to as a “shadow”, is the thin line extended from either side of the body. The extremes of each wick represent the price extremes of the candle and contain the high or low of the candle’s range.
Where is the high and low of a candle?
Naturally, to find the high, we pinpoint the highest price point of the candle, which could be an upper wick, the open, or close. To find the low, we pinpoint the lowest price point of the candle, which could be a lower wick, the open, or close.
In each of these cases above, the high and low can be found at the extremes of the wicks on either end.
Now we can see why they call them “candlestick” charts! When we combine the rectangular body with a thin wick, we get the shape of a candlestick. And by interpreting the structure of the candle, we can easily identify the open, high, low and close of each candle’s time interval.
A Candlestick Chart is more informative than a line chart, which only illustrates the close of each time interval, and that’s why candlestick charts are more helpful when assessing price action.
Interpreting Candlestick Charts
Now that we understand how each candle is constructed, let’s bring them to life and examine some of the ways we can use Candlestick Charts to read price action. We will examine the range of the candle along with the length of the body and wicks, and then take a look at what it means to use different timeframes.
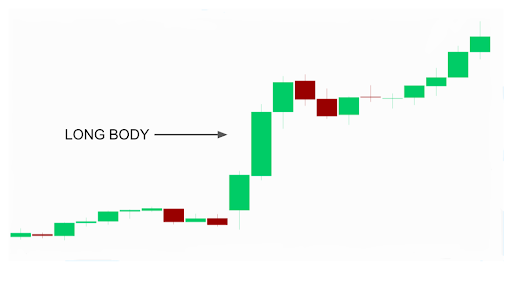
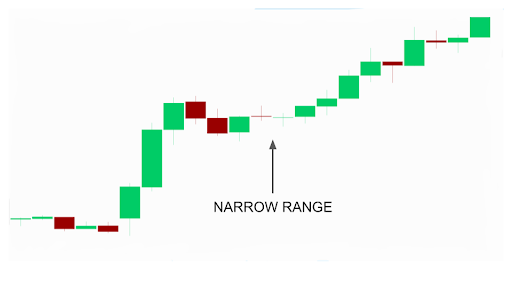
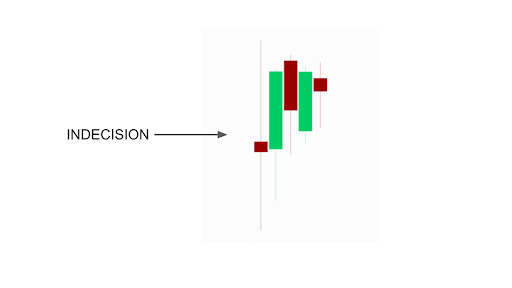
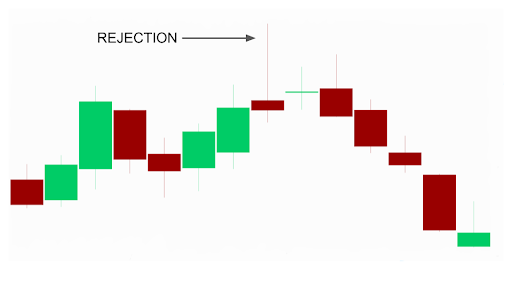
Candle Price Action: The range of the candle can tell us something about the volatility of the market. The length of the body and the wicks can tell us even more information about the price action within each candle.
A candle with a long body signifies a strong directional price move within its time interval. A series of consecutive large directional up or down candles can represent range expansion and a strong trend.
A candle with a narrow range signifies minimal price movement within its time interval. A series of consecutive narrow range candles at similar prices or within the range of the previous candle can represent volatility contraction and price consolidation.
A short body with long wicks on both ends signifies minimal net change between the open and close within a large range. These candles often represent indecision by market participants.
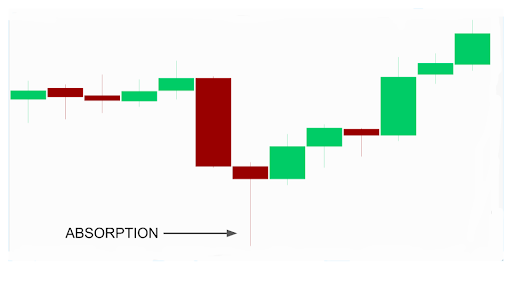
A very long upper wick and a close near the low of the candle tells us that price attempted to rally and was rejected, all within the time interval of the candle. A series of long upper wicks or one very aggressive upper wick at a key price level can represent rejection at potential resistance.
Conversely, a very long bottom wick and a close near the high of the candle tells us that price attempted to drop and was bought, all within the interval of the candle. A series of long bottom wicks or one very aggressive bottom wick at a key price level can represent absorption at potential support.
The elements of each candle are building blocks that tell us a story as they print on the chart. The entire story told through the cumulative effect of the candles on a chart is much more important than any one candle in isolation.
We can use different timeframes to zoom in and out in order to see the entire picture.
Timeframe: As you now know, each candle represents a time interval referred to as the “timeframe”. On a 1 minute timeframe, each candle represents one minute of price action. On a 30 minute timeframe, each candle represents thirty minutes of price action. On a daily time frame, each candle represents one day of price action from the 9:30 am open to the to 4 pm close. And so on.
A new candle will start printing for the current time interval after the previous candle closes.
1 MIN CHART


30 MIN CHART


DAILY CHART


A “higher timeframe” refers to longer time intervals such as a daily or weekly chart and provides a more zoomed-out perspective. A “lower time frame” refers to shorter time intervals such as a 5 or 1 minute chart and provides a more zoomed-in perspective.
I like to use a 2 minute or 5 minute chart to look at 1 or 2 days of price action. I like to use a 15 minute or hourly chart to look at anything from 5 days to a month of trading. And I like to use daily and weekly charts to look back over the course of a quarter, a year, or longer.
When you start to use candlestick charts, play around with the timeframes to visualize which time frame represents your trading style and the way you wish to look at the market. It is a best practice to utilize multiple timeframes to get a multi-dimensional view of the market.
The Basics of Volume
Now that we understand how to read candlesticks, we can add volume bars to our chart, which show up as a subgraph at the bottom of our chart.
Each volume bar represents the amount of shares traded during the corresponding candle’s timeframe.


As we read the chart, we can associate the volume traded with each candle’s price movement. This can be helpful when assessing significant moves. Notice how the volume increases in the above chart on this gap down and continuation. There was clear interest in selling this stock on this day.
Traders look at volume to analyze the participation behind a price move. How many shares were traded here? How many shares were traded compared to its average?
We will cover this dynamic in more detail later in the article.
Technical Indicators
Everything in technical analysis is pure math. This is because everything’s a function of time, price and volume. The candlestick chart is a graphical representation of price points over time. The volume bars below the candlesticks are pure volume, number of shares traded. This can certainly be enough for some traders to analyze the technicals. However, there are also things called technical indicators that break down the math of time, price and volume in different ways.
Let’s dive into 4 of my favorite technical indicators so that you can get a feel what these things are and how they can help us trade:
Moving Averages
A moving average is the average price of a stock over a specified time period. The reason it’s called a “moving” average is because this specified time period rolls ahead as new bars print, so the bars used to calculate the average move along with time. We can plot a moving average on our price charts like this:

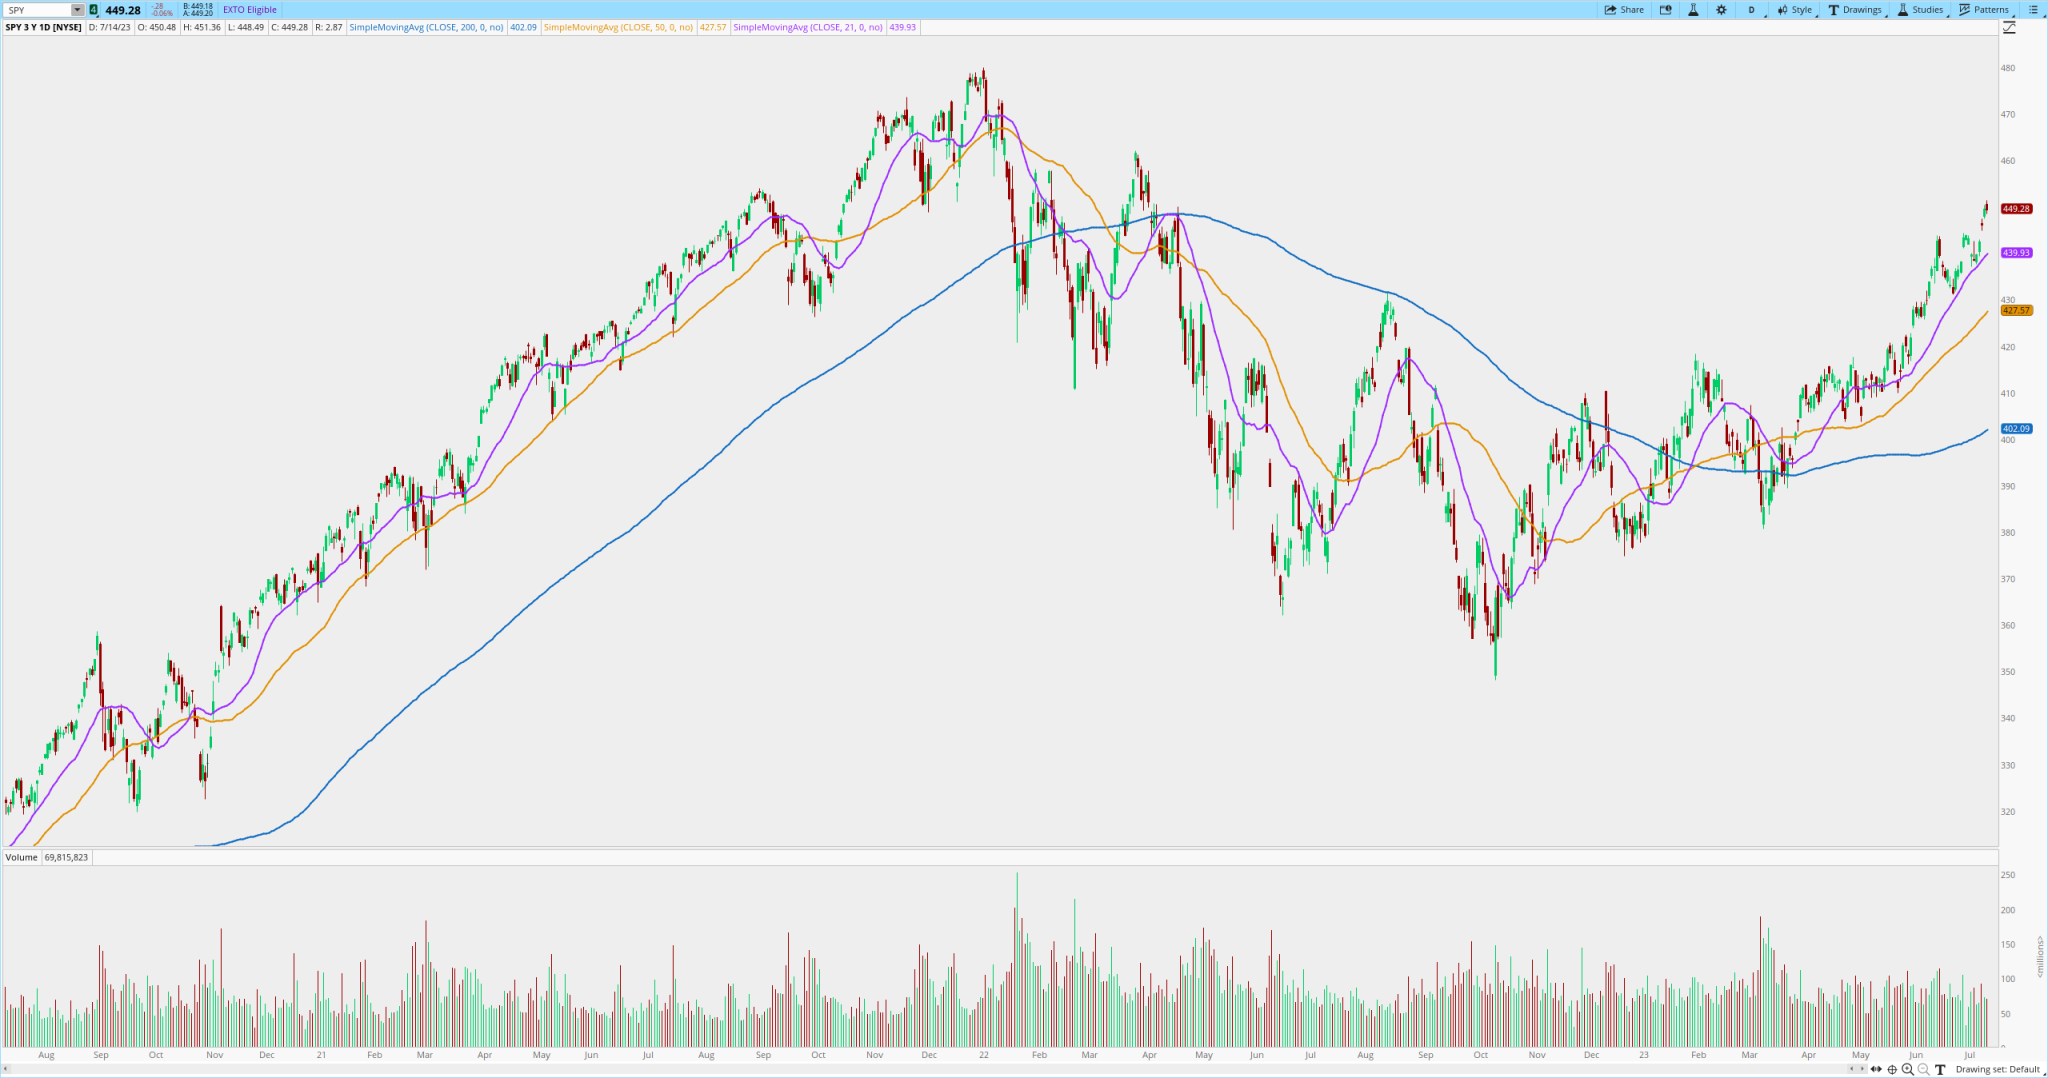
Common moving averages on the daily chart used by traders and investors are the 21-day MA, 50-day MA and the 200-day MA – all shown above on the chart.
Think back to how these indicators are just math. These moving averages are average prices. They represent the mean on various timeframes.
For example, the 21-day moving average (shown in purple) is the average price over the last 21 trading days (about a month). The fifty-day (shown in yellow) is the average price over the last 50 days. And the 200-day, our longest moving average on the chart (shown in blue), shows the average over 200 days.
This above chart shows daily candle data for the last 3 years. Notice how during the first half, roughly July of 2020 into the end of 2021, the moving averages are stacked and orderly, demonstrating a clean uptrend. Then, when the bear market begins in 2022, this pattern breaks and the moving averages become much less orderly.
We can use moving averages to see if price is trending on that timeframe, and assess how extended it might be from its mean. Most traders use moving averages as guides rather than specific price levels.
VWAP
Volume Weighted Average Price (or VWAP) is a cumulative average of price from the first bar of calculation, each bar weighted by volume. Just like a moving average, we can plot it on our price chart like this:


Most traders use an intraday VWAP, anchored from the first bar of the day, as shown above on this 1 minute chart of NVDA. Some traders anchor their VWAPs freely, and use them on higher time frames.
VWAPs represent the average transaction price for the period in which it calculates.
Traders use VWAP to visualize the relationship between supply and demand over that particular period. If price is holding above VWAP, it is thought that buyers are in control. If price is holding below VWAP, it’s thought that sellers are in control. If price is above and below VWAP, there may be indecision or a battle going on between buyers and sellers.
ATR
Average True Range (or ATR) is the average range of the price bars over a specified time period. Just like the moving average, this time period is rolling.
ATR measures the volatility of the market.
Many traders on our desk look at the daily bar ATR of the stock they’re trading on a regular basis. This metric represents the average daily range of the stock and can be tremendously helpful in assessing, on relative terms, how far a stock has rallied intraday.
Let’s say TSLA’s daily ATR is 12 dollars. Instead of saying, “TSLA is up 6 bucks in the first hour of trade!” a trader will say, “TSLA is up half an ATR in the first hour!”. This provides a better understanding of it’s typical price movement, as we can see in this example that 6 bucks is a big move for TSLA to make in an hour.
RVOL
You might remember RVOL from our Stock Selection section. This is because Relative Volume (or RVOL) is crucial to finding active stocks, stocks that are “in play”.
If a stock typically trades 2 millions shares by 10:30 am, but today it has traded 6 millions shares by 10:30 am, we consider this stock to be doing 3 RVOL. That’s 3 times its average volume. This indicates that there is considerable interest in the stock today.
Sometimes, if news you think is significant is reported on a stock, you can check out the RVOL to confirm your suspicion. If the stock is doing normal volume, it’s highly likely the market doesn’t care about the news. But if the stock is doing 3, 5 or 10 times its average volume, then you know this move has generated significant interest.
Note: if you want to learn (in step-by-step detail) 3 of our top strategies that have a robust, proven edge, head over to tradingworkshop.com now. You won’t get better education than from a firm with over 50 professional traders who pull in millions from the markets month in and month out. And it’s 100% free for you to join, so if you’re serious about trading, you can’t afford to miss it.
Why Technicals Matter (concept of a Short Squeeze)
Why do we analyze the action of a stock itself when really, the stock price is supposed to be a reflection of how well the company is doing financially?
The fact is, that’s not always the case.
Think back to our discussion of supply and demand and how it’s the buying and selling pressure of the stock itself that moves the market.
Well, oftentimes this buying and selling pressure transcends any fundamental reasoning around the quality of the company.
And there’s no better example for this than a massive short squeeze in a stock.
A short squeeze is an aggressive move higher in price caused by an overwhelming amount of short covering in the stock.
Think about it. Sentiment in the stock is very bearish and positioning is skewed to the short side. Sentiment, in this case, is a contrarian indicator. Too much short positioning creates a lot of potential demand in the stock.
Now we have a dynamic where there is an abundance of short sellers who someday will have to cover their positions by buying back the stock – hence, potential demand.
What if price starts to rise, causing these traders to cover as their stops start to get hit?
This creates a feedback loop. Price can rise faster and further than one might expect in this situation. Everyone is a buyer!
In the beginning of 2021, GME, the infamous leader from the “meme stock” era, squeezed from sub 20 to 500 in one month, nearly 190 times the low of 2.57 reached 9 months earlier in April of 2020. This was an incredible short squeeze on massive volume. And the company itself was generaly losing money.


If you read the technicals of the stock, you would have been able to identify the short squeeze and witness multiple technical breakouts on eleveted volume along the way.
Fundamental Analysis
Unlike Technical Analysis, Fundamental analysis is the study of information that comes from the performance of the company itself rather than the action of the stock. This could include balance sheets, a financial report or a news catalyst that may change the way the market sees the company. After all, by trading stocks, we own shares of the company, and a trader might want to understand if the business is growing or not.
When looking at fundamentals, it’s always important to think about what might be a surprise to the market versus what might already be priced in. Just because a company has a strong balance sheet and tremendous growth does not mean that it will trade higher in the near future.
But if we can find instances where the fundamental picture changes and forces the market to rethink the stock, then we have a situation where the supply and demand relationship in the stock might shift dramatically.
Think back to our baseball card example. If you buy the baseball card of your favorite player expecting him to have a good season, but the consensus of the entire baseball nation is that he will have a great season, then he might have to win league MVP or win a championship this year for him to surprise the market and for that card to significantly rise in value in the near future.
Earnings season, which happens four times a year, is the time when public companies report quarterly earnings. These reports can offer fantastic opportunities to trade active stocks with shifting fundamentals. For some traders, earnings season is their playoffs.
Personally I like to combine technicals with fundamentals to make trading decisions. But when the rubber hits the road, the price of the stock is what we’re trading and the supply and demand dynamic for the stock is what moves the market. That is an important fact to remember.
What You Need To Become Successful
Many of us grew up playing sports or learning a musical instrument. Have you ever studied the masters (or maybe you are a master yourself in such a field!) and wondered how these people get so good?
Of course, there is a lot that goes into it. And trading is no different. These are all high performance endeavors, and they require routine practice and a high level of focus.
Trading Fundamentals
When I was kid, my dad was a basketball coach. He helped coach a youth program that developed high-level division one athletes, as well as one career NBA player. There were certain things that he required his players to practice everyday – things like footwork, dribbling drills, and foul shots. These are fundamentals.
In trading, we too have fundamentals that we should master if we want to have a chance at becoming elite. Things such as stock selection, chart reading, tape reading, and risk management are all fundamentals that SMB teaches its new traders.
Stock Selection
Mike Bellafiore, an SMB Capital partner and someone who’s been a crucial mentor for me over the years, wrote in One Good Trade, “You are only as good as the stocks you trade.” This is true! If you’re trading the wrong stocks you will not make money.
Imagine you are the best concert pianist in the world. Just before your concert begins you are given a terribly written piece of music to play for the audience. No matter who is playing it, it just sounds awful. Your hands are tied – you won’t be able to sound good. Trading is the same. The stocks are our vehicles. We have to choose the ones that will move well.
The stock you choose will largely depend on the strategy that you trade, but generally, some universal things I look for include:
Fresh News Catalyst: A news catalyst that catches market participants off guard will fuel participation in the stock and create supply and demand imbalances that could generate opportunity for traders. This can be as fast as breaking news, or as slow as a large fundamental shift that fuels the stock for weeks.
Relative Volume (RVOL): Looking at the amount of volume the stock is trading relative to how much it usually trades is typically a fantastic way to measure the level of increased participation and interest in a stock. This can be measured intraday or over the course of a number of days.
Relative Strength and Relative Weakness: Finding a stock that is significantly stronger than its peers or significantly weaker than its peers can be a great way to filter for stocks that have unusual trading activity.
Technical Catalyst: A stock with an A+ technical setup can present great risk/reward trading opportunities. This could be a hold of a significant price level or a gap extended significantly from it’s mean.
Respecting Levels: If a stock is respecting price levels and “trading well”, then this becomes a candidate, especially if other factors are aligning. The cleanliness of how a stock is trading often reflects significant strength or weakness, something I want to gravitate towards. If a stock is trading erratically and unpredictably, I don’t want to be involved.
We say that a stock is “in-play” if it’s exhibiting any of these behaviors that demonstrate an unusual amount of activity and interest in the stock. Ultimately, as traders, we want range, liquidity and direction in the stock we’re trading. Trading “in-play” stocks will help us find better risk/reward opportunities.
Chart Reading
Chart reading is the study of the historical price movement and volume of the stock you are trading.
Technical Analysis, something we defined briefly in our terminology section, is any kind of information gleaned from the price movements and volume of the stock. Naturally, traders look at charts to visualize these technicals.
The price movement of a stock is caused by the buying and selling from market participants. Recall the supply and demand dynamic that we spoke about earlier. We can use price charts to see this dynamic at play.
We might identify demand at a certain price level where buyers have stepped in and pushed the stock higher. We often call this potential support:


The above chart shows TSLA getting bought twice at the same price level.
Similarly, we might see supply at a certain price level where sellers have stepped in and pushed the stock lower. We often call this potential resistance:


The above chart shows TSLA getting sold twice at the same price level.
These becomes significant levels of interest. When the stock trades back into these levels, we will watch it closely.
Support and resistance levels typically reveal themselves when the stock has developed a trading range. The two examples above were both taken from the same TSLA chart. Let’s zoom out a little to identify this trading range in TSLA.


The blue rectangle represents our trading range. On the right side of the blue rectangle, we can see that price finally broke the range to the upside, came back and retested, held, and traded higher. This is called a breakout, a powerful setup that we’ll cover later in this article.
When a stock is not stuck in a range, there might be an uptrend in place, established by higher highs and higher lows and an upward sloping price path:


The above chart shows NVDA in a clear uptrend, with the higher highs and higher lows marked on the chart.
A downtrend, on the other hand, is established by lower lows and lower highs and a downward sloping price path.


The chart above shows QQQ in a clean downtrend, this time with price swings within the downtrend marked on the chart.
We might see a big volume surge on a break of a key price level, signifying increased interest and participation in the price move.


The chart above shows SMCI break out above a key price level on significant volume. You can see the surge in volume on the initial breakout, and then again, a pickup in volume on the secondary breakout.
These are all simple examples of how traders use charts to look at historical price and volume patterns to help frame the current market and the risks, rewards and probabilities around their trades.
If you want a short-cut to learning how to trade profitably using all of these concepts and tools, we invite you to attend our free, intensive trading workshop, where we’ll teach you the exact ins and outs (in step by step detail) of our 3 top performing trading strategies. You’ll learn the specific rules of entry and exit in far more detail than we can provide here. Reserve your free seat here.
Tape Reading
Tape reading is the study of the “order flow” of the stock you are trading. The tape is a tool that allows traders to see the orders that are getting executed on the bids and offers. The tape consists of two components, the “level 2” and “time & sales”.
Level 2: This is the order book. It shows the bids and offers for the stock you’re watching. The highest bid and the lowest offer comprise the inside market, and when you’re placing a market order, you will be able to see the bid or offer that you will be taking, and the size that it’s showing.
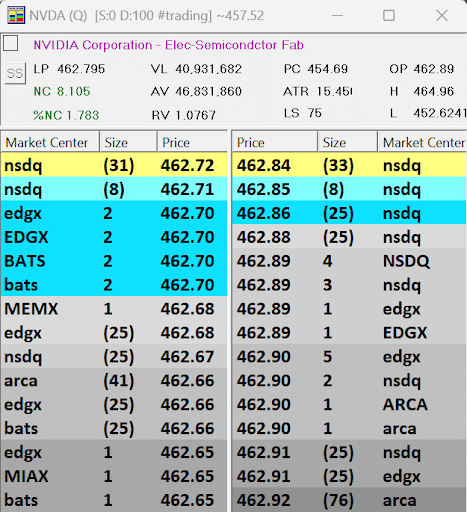
In the example above, the inside market is at the top, highlighted in yellow. NVDA is showing 31 shares at 462.72 on the bid and 33 shares at 462.84 on the offer. The bid side is on the left with the highest bid at the top and so, of course, the ask side is on the right with the lowest offer at the top. In this case, the spread is 12 cents which we get by subtracting the highest bid from the lowest offer – if we pay the 462.84 to get in we have to sell the 462.72 to get out.
Time & Sales: Also known as “the prints”, this is a record of real-time transactions that are going off in the stock you’re watching. These transactions represent aggressive orders that are hitting the order book and taking shares from the bid or the offer.
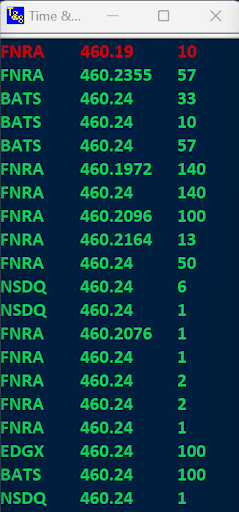
In the example above, we can see the orders that are getting executed on the time & sales for NVDA. In this example, the most recent order that hit the tape was the red sale of 10 shares at 460.19 shown at the top. All other prints are buys as indicated by green coloring.
On my box, I do not show the actual time of day because these orders are zooming by quickly in realtime, so for me this info is unnecessary. What I do care about is the speed of the tape, the color indicating if it’s red for a sale or green for a buy, the price and the size. The market center is also shown on the left.
Traders watch how the Time & Sales interact with the Level 2. This is how we see the order flow.
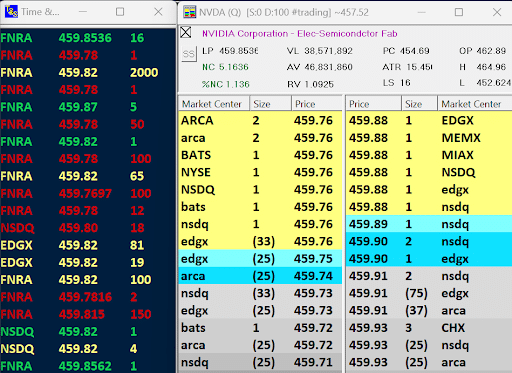
In the example above, the time & sales is shown along with the level 2 for NVDA. This is my tape. This is how I watch the stock that I’m trading.
We can see that the last transaction that took place was a buy of 16 shares at 459.85. We can also see that the current highest bid is 459.76 and the current lowest offer is 459.88. When we go to place a market order to buy NVDA, we can expect to get filled at 459.88 until those offers are all taken or pulled. When our order gets filled, it will flash across the time & sales. In this case there are a total of 600 shares offered at 459.88 – that’s because “1” represents 100 shares and there are 6 of these 100 share offers at 459.88, all at various market centers. Once those offers disappear, the market will move to the next offer at 459.89.
Let’s say your stock is trading at 60.80 and you passively post a limit order to sell 100 shares at 61. Your order, if it doesn’t immediately get filled, will now be seen sitting in the order book on the Level 2. Your 100 shares will be there at 61 waiting for some aggressive trader to come by and pay the offer at 61 and take your shares.
Now let’s say you see on the Level 2 that the highest bid is at 60 dollars and it’s showing 1,200 shares to buy. You decide to aggressively send a market order to sell 100 shares. When you sell 100 at the market, your 100 shares at 60 will flash across “the prints” screen in red letters as it hits that 1,200 share bid. Now you will have sold 100 shares at 60 and the bid will now show 1,100 shares, because you took 100 of the original 1,200.
This is how the Time & Sales interacts with the Level 2.
In real-time, there are many trades going off at once. Traders use the tape as a way to visualize order flow, and see buying and selling pressure at certain price points. It can seem overwhelming at first, but the more you watch it, the more it makes sense.
When you watch the tape, imagine the prints on the time & sales as water pressure and the bids and offers on the Level 2 as a river dam. With enough pressure, the aggressive orders can take all the size on the bid or offer, and if the damn is not strong enough, the aggressive orders will push through the damn to the next price level. This is how markets move.
Whether you’re an intraday trader looking to play off particular bids and offers, or whether you’re a swing trader looking to assess the character of the tape and see the order book as you’re executing a trade, reading the tape is a valuable skill for any trader to have.
The tape is a key part of my trading setup, which I describe in a video about my setup here on the SMB Capital YouTube channel.
Risk Management
Risk management is important to understand before you start trading with real money. It’s what will keep you in the game so that you can continue to learn and build your craft.
At SMB Capital, each trader, and each account, has a “daily loss limit”. This means that there’s a certain amount we are allowed to lose before our account is no longer able to put on risk for the day. This may sound mean, but it’s actually doing us a great service.
Some days the market is more difficult than others. Some days we just don’t have it as traders. It becomes important to recognize these days and let your foot off the gas, and wait for only the best setups.
We discussed earlier how it’s possible to predefine our risk in a single trade. Well, this individual trade risk becomes a function of our “daily loss limit”, and so we can set our risk per trade to gracefully interact with our loss limit and trade within our risk guidelines.
When we grow, when our strategies grow, we increase our daily loss limit and our risk per trade.
When you start out trading, decide how much you are willing to risk per day and design your trade risk around that number. This will keep you within your own guardrails and assure that you survive as you grow towards becoming a profitable trader.
Trading Process
So you’ve educated yourself on the fundamentals of trading. Now, how can you assure that you’re doing everything you need to do to grow and advance your abilities on a daily basis?
When my dad was coaching our basketball team, it was not enough that we learned the fundamentals. We had to practice them every day and build our arsenal of moves and game-time awareness. We would have a process for this – 30 minutes of dribbling drills, 500 shots a day, tape review, team-building exercises, and weight training.
In trading, our process is what keeps us developing and adapting to changing market conditions. We will discuss things like the Playbook, review work, research, technology, gameplanning, personal care and trading rules.
Playbook
When an NFL quarterback takes the field, he’s not just winging it. He has specific plays that he and the coach call depending on the gametime situation. This allows them to follow a process and make sure they are maximizing their edge on every possession. How do the QB and the coach keep track of these plays, refine them, and study them? They have a Playbook.
Trading is no different.
A Playbook is a document compiled by a trader that catalogs his or her setups, with specific examples broken down with charts, trade variables, and market statistics.
As a new trader, you start without a Playbook. So you must develop one.
And as an experienced trader, you’ll want to refine and add to your Playbook.
Start by reverse-engineering successful plays that make sense to you. Mark up the charts. Take screenshots. Record the variables that make this play actionable and repeatable. Record market conditions that coincide with your setup. And categorize these examples into clearly defined setups.
And don’t worry about making mistakes. As you add trade examples to your Playbook, you will find that you’re improving at identifying A+ trades, and you might choose to eliminate older, less powerful examples as they become less relevant.
When I look back to some of my original Playbook entries, I can’t believe how muddled and naive they were, but we have to start somewhere, and this is a best practice that will help you figure out what kind of trader you will become.
Now when the opening bell goes off, and you start watching the market, you will be armed with specific variables that will help you make calculated decisions, just like the NFL quarterback.
Book of Charts
Just like in the worlds of history and science, there are patterns in the stock market that tend to repeat themselves. A successful trader builds a keen understanding of these patterns. As we’ve discussed, charts help traders make sense of historical patterns that might repeat themselves in the future.
We want to keep a Book of Charts as a way to commit to memory these repeatable patterns.
A Book of Charts is a catalogue of charts. It differs from our Playbook in that it’s more informal. A single entry could be a screenshot of a chart that includes a pattern that you find interesting – something you might have seen repeat in the market enough for you to record it.
Review Work
When our NFL quarterback finishes the game, win or loss, he doesn’t just forget about it and move on. He watches film of the game. This allows him to learn from mistakes and make adjustments for the next game.
The same goes for traders. We want to review in detail our trades, especially the biggest opportunities, along with how well we are following our process.
Review work can come in many different forms, and this largely depends on your learning style and personality.
Some traders on our desk keep a journal where they jot down everything from execution mistakes and milestones to how they were feeling that day.
Some traders record their screens, and like the quarterback, review film of the tape after each trading session.
Some keep a Daily Report Card (DRC) where they grade themselves on a set of criteria that they’ve defined for the month.
The common thread I find among effective review methods is detail. Trading is all about making adjustments, so we want to be detailed about things that we’re doing well and want to repeat, and things that we need to adjust and the ways we’ll take action to make these adjustments.
I’m a numbers guy. I like focusing on things that are clearly definable. So I find keeping a spreadsheet around each of my trading businesses is the most helpful to me. Each day I record the variables that factor into the quality of my trades, the risk that corresponds to the quality of these setups, the executions, and the environment which informs me of which plays to make.
This allows me to see quickly, and in detail, which parts of my trading needs attention.
I call my daily spreadsheet the “Trade Log” and I did a video about it here on the SMB Capital YouTube channel.
You may be starting to notice how these processes are linked together and how important, for example, having a clearly defined Playbook can help us review our trades relative to our clearly defined plays.
Research
The market is always changing. Environments shift back and forth between bull and bear markets, fast and slow markets, momentum and ranging markets – and the most successful traders on our desk have not only been able to develop a setup with edge, but they’ve been able to broaden their Playbook to include multiple plays for various environments.
This breadth will allow you to make money consistently.
Imagine you’re a guitar player who can rip a guitar solo as well as anyone in the world. But you feel that your finger picking chops are poor. You want to be able to get called for those jobs where intricate rhythm playing is crucial, especially if guitar solos go out of style.
How will you go about this? You’re going to examine the best examples of finger picking styles, learn them, practice them, and spend a year figuring out how to apply this to your own playing.
In trading, we have the opportunity to do the same, and much of this is done through market research.
I spend a good chunk of my time conducting research. This work does not pay off immediately, but in the long run it can be incredibly powerful. And that’s why we want to build research into our process.
You might have an idea. You might find 100 examples of this idea. You might extract statistics from these 100 examples and study them, refine your idea, and come up with a setup that is not just a theory, but has the statistics to back it up.
Some of my best plays have come from this practice. It’s creative. It can be fun. And it’s definitely fun when it can make you money.
So on the weekends, or when the market is slow, take an idea and look into it. Let that process take you down a rabbit hole. And you might find more edge in an existing play. You might add breadth to your Playbook. This kind of curiosity and in-depth work is a common thread throughout the most successful traders on our desk, and is paramount to fostering longevity in this business.
If you’re interested in hearing more about the process we take when developing a play, I made a video about it here on the SMB Capital YouTube channel.
Technology
Technology is not just a tool. It’s a skill.
In trading, we can use technology to our advantage. We can create market filters that alert us to tickers that are trading a certain way. We can create indicators that alert us to special market conditions. We can write scripts that trade stocks for us based on specific criteria. We can backtest strategies as part of our market research.
The more we understand how to use the technology, the more powerful we become as traders.
This is why I build technology-work into my process. I make sure that each week I’m spending time either creating technology that can give me an advantage, or increasing my skills so that I’m able to do more with technology.
And frankly, the more skills I obtain, the more time a week I find myself spending on technology, because it’s just that powerful.
The world is evolving quickly, and the trading world is evolving right along with it. It’s my advice to any new trader to start early and begin developing tech skills.
This can be as simple as getting to know your platform inside and out, or as advanced as learning how to code.
You don’t want to find yourself playing the PGA Tour with a wooden driver. That worked in the 1970’s, but today you’d be at a great disadvantage with the titanium clubs available.
There was a time when traders operated on the trading floor, reading the energy of the pit and shouting over one-another, passing pieces of paper to get their orders filled. When the world changed, and technology allowed traders to operate upstairs on computers, it was traders like Linda Raschke who adapted, learned new technology and were able to survive and flourish.
I try to be like Linda and build into my process ways to stay one step ahead of the competition.
Game-Planning
Every day in the market is different – with different flows, different stocks in play, and different market narratives.
Just as a basketball coach will cater his or her approach to a specific team, with specific matchups and tactics, a trader will design a game-plan before each trading session.
Depending on your style, this might include specific stocks that you’re watching, key price levels, fresh catalysts in the market, and any economic data that might be released during the day.
As traders, we often operate with “if-then” statements. If my stock does this then I will do this. Basing your game-plan on if-then statements is a solid way to focus your pre-market preparation.
And just like the basketball coach, you will most likely be forced to modify this plan with “gametime decisions” once the market opens. This is okay. Starting with an outline of what we are looking for helps us streamline our efforts and stay focused. And then we stay flexible and open minded.
Trading Rules
We have our Playbook. We understand our setups inside and out. We know what market variables need to be present for us to enter a trade, and we have outlined how to execute these trades. To put it simply, we have trading rules.
The market can be tricky. Jesse Livermore, the great stock trader from the 1920’s, once said, “The stock market is never obvious. It is designed to fool most of the people, most of the time.”
This is why we have trading rules. Without rules, it will become very difficult to do the right thing. Instilling these rules as part of our process will help us stay in-line with our trading system.
And in our trade review, we can grade ourselves on how well we’ve followed our rules. If you’ve clearly defined your trading system, there is no excuse for not following your rules. If you find a flaw in your trading system, it is better to modify your system in a calculated way than it is to break your rules.
Imagine you are an algorithm that takes trades only based on specifically predetermined conditions. Would you be able to outline this logic from front to back and follow the system? I would wager that most struggling traders would be surprised to find that they are unable to outline the logic of their system, with no holes, from front to back.
Personal Care
Imagine being a concert pianist at Carnegie Hall or a tennis player in the final round at the US Open. Think of the pressure these performers must overcome on a regular basis. These performers often have physical trainers as well as psychology coaches to keep themselves in gear and ready to face the challenges of peak performance.
Trading is a performance too. Therefore, our own mental and physical health is crucial.
Let’s outline some of the basic ways the traders on our desk keep themselves in tune.
Diet & Exercise
Mick Jagger is known for his wild antics as the Rolling Stones frontman. But he has a serious responsibility, and he’s found ways to keep himself in peak condition in order to headline stadiums consistently throughout his career. As part of his process, he maintains a diet of fruit and vegetables, whole grains, legumes, chicken and fish. He commits to regular interval training and stretching routine.
If Mick can do it then why can’t we?
As traders we need to feel energized every day. Most people understand what makes them feel good.
For me it’s running. I love to run in order to clear my mind and get in a good sweat. Whenever I let my busy schedule interfere with my running routine, I can start to feel it show up in my trading. I lack sharpness. I’m not as energetic. I just don’t feel as good. So I do whatever I can to prioritize getting out for a run, almost every day.
Sleep
Sleep is one of those things that is very easy to ignore. But we all know how important sleep is to our cognitive ability, not to mention our ability to keep up with our workout schedule.
Many of us on the trading desk track our sleep.
Some traders will take a step back if they notice they have not gotten a good nights sleep. That’s how much it can affect your performance.
I do a lot of coding in my script and algorithm development. I find that a lack of sleep greatly reduces my efficiency and accuracy when writing code, something that can really make or break my progress.
Mindfulness
In the Oxford dictionary, mindfulness means the quality or state of being conscious or aware of something. In trading, this is our game. With all the noise and trading signals in the market on a given day, we must be conscious and aware.
I like to use running as a way to clear my mind. I also like to spend time with friends and family, as trading can be a solitary journey.
Some people use meditation.
You might find that self-talk works for you – being kinder to yourself.
It will be a valuable exercise to find out what works for you. What activity helps you gain a clear mind for trading the market?
Psychology
As the tennis legend Billie Jean King once said, “pressure is a privilege”. You can’t make diamonds without pressure, right? This is what we’re signing up for.
It’s very natural to feel nervous, upset or under-pressure while trading. No serious competitor in any high performance endeavor is going to escape these feelings.
There’s a LOT of talk out there on trading psychology. I’m certainly not a psychologist. But I am a trader and understand the challenges we face.
I’ve been there. The feeling of a stock dropping as soon as you buy it. The disappointment that comes with a bad trade, a bad month. The pressure to perform when you’ve had a losing streak.
And of course, there’s the notorious term, “on-tilt”, used to describe a state of acting irrationally out of emotion when trading.
It’s easy to let our emotions get in the way of quality decision-making. This is why we have a process. This is why we don’t just wing it.
Dr. Brett Steenbarger, an associate with the firm and a valuable mentor throughout my career, has written some fantastic books on trading psychology. But, as Dr. S. would concur, psychology doesn’t matter if you have no edge in the market. A lot of psychological challenges can be solved with having a solid trading system with edge.
Let me say that again: It might be easy to conclude that your problems with losing money are due to psychology when, in fact, you’re not trading setups with edge.
Therefore, if you focus on the three personal care practices outlined above (diet & exercise, sleep, and mindfulness) and combine them with finding a trading system with edge that works for you, you’ll be putting yourself in a great position to find success.
If you feel that you have the willingness and dedication to do this, then you need to attend the free intensive workshop we’re currently running, which teaches you 3 of our top performing trading strategies in exact, step by step detail, so you can start using them in your own trading. Test them out for yourself and start building a consistent track record. We’re always looking for promising new traders to hire! Reserve your free spot now.
So we’ve covered trading fundamentals, our process for growth, as well as ways to keep ourselves sharp for performance. Is there anything else we need?
Well, yes. Patience.
Learning to master anything takes time, and trading is no exception. We’re competing against the best in the world every day.
One thing that’s helped me tremendously is having great mentors. For me it’s been senior traders on the desk like KFitz, or trading coaches like Bella or Dr. S.
I want to surround myself with people better than me.
If you don’t have access to a trading desk yet, you could reach out to a successful trader. You might be surprised by how receptive they are.
Or you can devour books on trading, written by successful traders.
Mimicking successful traders and their process, even their setups, is a great practice.
If you’re interested in learning more about what it takes to become successful, check out Lance’s video The Single Biggest Secret to Profitable Trading on the SMB Capital YouTube channel.
So now that we’ve set up the basics of what stock trading is and what we can do to help ourselves become successful, let’s get into the nitty gritty. In the next 2 sections we’ll cover the basics of how we can find setups with edge. We’ll go over the ingredients of a profitable strategy, and a few specific trading setups.
The Ingredients of a Profitable Strategy
You’ve developed a Playbook that you like. You understand what you want to see in the market in order to put the trade on.
You might be asking, how do I put this together so that I can make consistent profits?
How can I make this process automatic?
There are a number of factors that I like to consider, and drill down into detail, in order to hear the trading signal loud and clear.
The Environment
What kind of market environment are we in?
What plays are conducive to this environment?
Say you’re trading a long technical breakout, a strategy where we play for a big move when the stock gets above a key price level. But we’re in a bear market – all breakouts have been failing. Is this the same technical breakout as one that occurs within a bull market where dozens of stocks are breaking above key levels and running?
The answer is no. The environment matters.
Traders on our desk have certain plays for certain market environments.
The Play
We start with the big picture. We should clearly define in our Playbook what kind of play we’re making.
Is this a technical breakout in a relative strength stock?
Is this a day-2 earnings breakout?
Is this a breaking news play?
The big picture idea frames why we’re looking for an imbalance between supply and demand. Traders on our desk categorize these plays, and understand clearly what kind of play they’re making.
Stock selection is paramount here. If this is a high-quality play, then we’re in the right stock.
The big picture informs us, but it doesn’t mean we have a trade yet.
The Setup
Have you ever had a big picture idea, put a trade on, only to feel lost in the wild oscillations of the stock as you watch your stop get hit?
To avoid this, traders on our desk wait for the stock to set up.
A stock is set up when conditions that make this play A+ are present. A stock is set up when there is clear risk/reward. Create a checklist, and make sure all the checks are in your favor.
Say you’re trading the technical breakout. The market environment is right. You see that the stock looks like it’s breaking out. Well, this is not enough.
Does it have a strong catalyst? Is the stock doing over 3 RVOL? Is the sector in-play. Is the range on the daily chart compressed enough to make this a powerful trade? Is the time of day appropriate for a breakout? Is the order flow active, with offers being taken easily on the tape?
These are all questions you might ask yourself before looking to enter the trade. If enough checks are in your favor, then your stock is set up.
Now you know you have a trade, but how do you enter?
The Trigger
The trigger is the condition that gets you in the trade. Once all the checks are in your favor, you wait for your entry.
Within your particular strategy, do you like buying the first offer that lifts above the key level? Do you like buying the first pullback and retest after the stock breaks a level? Do you like anticipating the break as long as the stock hasn’t moved 1 daily ATR already?
And this could all occur in a split second, especially if it’s a fast play such as a breaking news play or a scalp.
Traders on our desk have all kinds of different styles. But each trader has ways to execute that make sense to them. And these “triggers” are usually specific to the strategy they are trading.
There are nuances to how you might manage a trade. and the way you manage the trade highly depends on how you enter. So this needs to be baked into the strategy.
Trade Management
I once made a fantastic breakout trade in IWM. It had been consolidating for months below a key level and it broke out on volume in a really strong tape. I felt like I was in the driver’s seat. After all, I’d been waiting for this trade for months, and it was working.
Three days into the trade I had substantial open profit. But my target was much higher, so there was nothing to do. I sat on my hands.
Then the market started to shift. The tape got weaker. IWM started to lose momentum. My open profit started to deteriorate. But I sat tight. I’d been waiting for this trade, and I didn’t want to give up.
Then I woke up the morning before Thanksgiving to see the entire market, along with my IWM position, had gapped down significantly. IWM opened well below my stop price. I had turned a big winner into a full loss – great way to spend Thanksgiving.
I was furious. Not because I had lost money, but because I had mismanaged the trade.
This loss forced me to define much clearer and in more detail the trade management rules for this particular strategy. I had ignored a handful of warning signs and I did not have rules in place to deal with these warning signs.
I’m worlds better at trading this strategy now, because nothing can get me to manage the trade poorly. I have clearly defined rules for every possible outcome.
Different traders have different styles. But there is going to be a trade management method that best suits you and your strategy. Knowing how you will manage a trade before entering will help avoid a lot of confusion and poor decision making.
One of my top plays is capturing a market trend day. These are rare, but highly profitable if you are patient and strike with intention. I made a video outlining the factors of this play here on the SMB Capital YouTube channel.
Specific Trading Strategies
So let’s talk about strategy.
No two traders on our desk are alike. They each have their own cognitive strengths, their own Playbooks, and each trade their setups in unique ways.
Jack Schwager interviewed dozens of highly successful traders in his classic trading series, Market Wizards. One of the conclusions he drew from the interviews was that, “there are a million ways to make money in the markets. The irony is that they all very difficult to find.”
So while the following strategies are real-world applications, completely legit ways to trade the market, they are basic introductory-level guidelines – you’ll want to add detail, nuances, and your own twist in order to capture true edge in the trade.
Support and Resistance
Recall the supply and demand levels that we discussed in the Technical Analysis section. When trading price action, identifying high quality price levels is key. This is because stock prices tend to react off these levels.
One way they can react is by failing and reversing. A support or resistance play is made when a stock trades into a significant price level and we play for that level to hold.


In chart above, QQQ tested the same level 4 times before failing. You might have identified that the stock is in a downtrend, and you think the likelihood of it continuing along the current path of least resistance is high. In this situation, you can key in on this significant supply zone to get great risk/reward on a short trade.
You might look for a failure to follow through. You might look for volume to dry up, a change of character on the tape. There are many factors that can set up this play for you. But the key is that this basic support or resistance concept plays into the fundamental principles of supply and demand at a significant level.
Breakout
What happens if a significant price level cannot hold?
Well, we might have a breakout on our hands.
A breakout play is made when price compresses, builds up energy against a significant price level, and takes that level out with significant volume. This can cause a cascade of momentum to surge into the stock and follow-through in the direction of the breakout.
Recall our SMCI example from earlier:


We’ve discussed how important the volume was on this breakout, highlighted here in the blue shaded areas. This is an hourly chart. Let’s zoom out to a daily chart and assess the trading range that it broke out of.


The stock failed 3 times at 116 over the course of 3 months in a tight trading range before it broke on massive volume. Price compression builds energy for the stock. The volume on the breakout gives it fuel.
A breakout is often due to a catalyst or an entire sector move in the market. In the case of SMCI, this was a massive quarterly earnings beat and guidance raise amidst an artificial intelligence theme that was igniting many of the semiconductor names. It had all the ingredients of a good breakout trade.
Quite often, the time of day is important, as the most participation and price expansion typically occurs in the morning.
Mean Reversion
If a stock runs far enough after breaking out that it becomes significantly extended from its mean, like a stretched rubber band, it will often snap quite violently back to its mean.
A mean reversion play is made when an over-extended stock trades back to its mean. This is often a counter trend trade, and made on intraday time frames.
Do you remember hearing about the meme stock madness in 2021? GME traded from sub 20 to almost 500 in less than a month! This kind of move is extremely rare.


The above chart shows GME on the daily chart (price-adjusted for stock splits). Notice how steep it gets. Notice how extended from its moving averages it gets. Notice the volume that comes into the stock.
When GME got overextended, it eventually offered a fantastic intraday breakdown trade, shown below on this 1 minute chart:


Notice the intraday trading range marked by the blue rectange, the breakdown below VWAP, the increase in volume, and the volume climax at the low.
A stock can run further than expected, so it’s critical, just like in any play, to have proper trading signals in place and plenty of checks in your favor.
Momentum Scalping
Some stocks, when in-play, have tremendous order flow. This means that traders are able to gain a lot of real-time information from watching the tape.
A trader might identify a significant hold on the bid and then see them pay the offer aggressively. A trader can join in this order flow, and look to exit when the pattern changes. Sometimes a trader will combine this order flow with significant price levels to gain edge in the trade.
These are very short term moves, and require quick thinking and decision making skills.
These 4 strategies are guidelines. They are starting points. You can start with something simple like a Breakout strategy and develop it further, adding your own twist.
Say you are very good at dissecting earnings reports, and you do well when trading stocks that are in-play with fresh news catalysts. You might specialize in day-1 earnings breakouts. Your checklist of trade attributes, environments, and triggers will be specified to earnings-day 1 situations.
After learning about all of these strategies we do hope you are armed with better information and knowledge to move forward. We invite you to learn more about trading by attending our free online trading workshop, where we share 3 of our top trading techniques (in exact, step by step detail) our New York City proprietary desk uses to profit consistently from the market virtually every month.
FAQs
- What is the minimum amount of money required to start stock trading?
Different brokerages have different minimum deposit requirements. However, with the advent of fractional shares, it is now possible to start trading with a small amount of money.
Active intraday trading requires larger amounts of capital and leverage because traders are looking to capture small price fluctuations and close out the trades before the end of the day.
The pattern day trader rule (PDT) is a regulation for those traders who execute four or more intraday trades over the span of five business days using a margin account where the number of day trades constitutes more than 6% of the account’s total trade activity during that five day window. This designation is put in place to discourage investors from trading excessively.
- How do I choose a brokerage firm to use for stock trading?
In this day and age, it is entirely possible to get a competent trading platform for free as long as you deposit a certain amount of capital into the account.
Some high-end charting platforms operate independently of brokerage firms, offering all the tools without trading capability; so it is possible to combine a brokerage firm with a charting platform that suits your needs.
Ultimately, the choice boils down to personal preference, as each option offers varying degrees of control and a diverse array of features.
- Can I make a living from stock trading?
Yes, some people do make a living from stock trading. In fact, it’s possible to make a substantial amount of money. However, it requires a significant amount of knowledge, experience, and hard work, as well as a well-tested strategy. Trading involves substantial risk, and not everyone who trades will be successful.
- What are the tax implications of stock trading?
Profits from stock trading are usually subject to capital gains tax. This is a tax levied on the profit obtained from the sale of an asset or investment. Simply put, when you sell a stock for more than you purchased it, the resulting profit is subject to tax. Losses from the sale of assets can offset your capital gains and reduce your tax liability.
Short-term capital gains are profits made from assets owned for a year or less. These are typically taxed at your regular income tax rate.
Long-term capital gains are profits made from assets owned for more than a year. These are typically taxed at a lower rate than short-term gains.
- What are some common mistakes to avoid when stock trading?
There are two big mistakes I see traders make; one as beginner traders and the other as experienced traders.
The first is trading with money you can’t afford to lose. When we start out, we have to give ourselves room to fail. If you’re in an experimental phase, there’s nothing wrong with paper trading on a demo before going live.
The second is failing to continue to develop as a trader. The market is always evolving and you have to evolve along with it.
Albert Einstein once said, “Once you stop learning you start dying”, and this could not be more true in the world of stock trading.
Wrap Up
There’s a lot of dogmatic trading talk out there. Many talking heads think their way is the only way.
Some will claim fundamentals are king, while others say technicals are all that matter. Some will say that reading tape is the only way to do it, others will only look at charts. Some consider buying a breakout to be “chasing”, others make a living buying breakouts.
From my experience, there are many different AND valid ways to trade, and the key is finding what YOU see really well. Everybody is different, with different cognitive abilities. I see it on our trading desk every day – various styles, timeframes, setups… and all with edge.
So my advice is, find what excites you and find what makes a lot of sense to you, because that is probably where you will excel.
This journey never ends. There’s always a next level. So if you feel excited about learning, then why wait?
And if you enjoyed this article, there’s more for you.
SMB Training has been teaching trading fundamentals to future successful traders for almost 20 years. Here, you’ll gain practical knowledge from real-world experiences that you can use to start building your own path towards trading mastery.
Cheers!
Garrett
P.S. If you want to accelerate your learning curve even faster, you can also attend our free, intensive trading workshop, where we’ll teach you the exact ins and outs (in step by step detail) of our 3 top performing trading strategies (and much more). You’ll learn the specific rules of entry and exit in far more detail than we can provide in one article. These are the exact strategies our 7 and even 8-figure a year traders use day in and day out. Reserve your free seat here.