The counter-trend trade has been the trade of the year thus far in the market. The trade is expressed via a long position in the SPY after a down move to recent support. The idea behind this trade is the market has a strong underlying bid and when it pulls back to a prior support level buyers will step into the market. At one point in January this trade had worked 8 consecutive times.
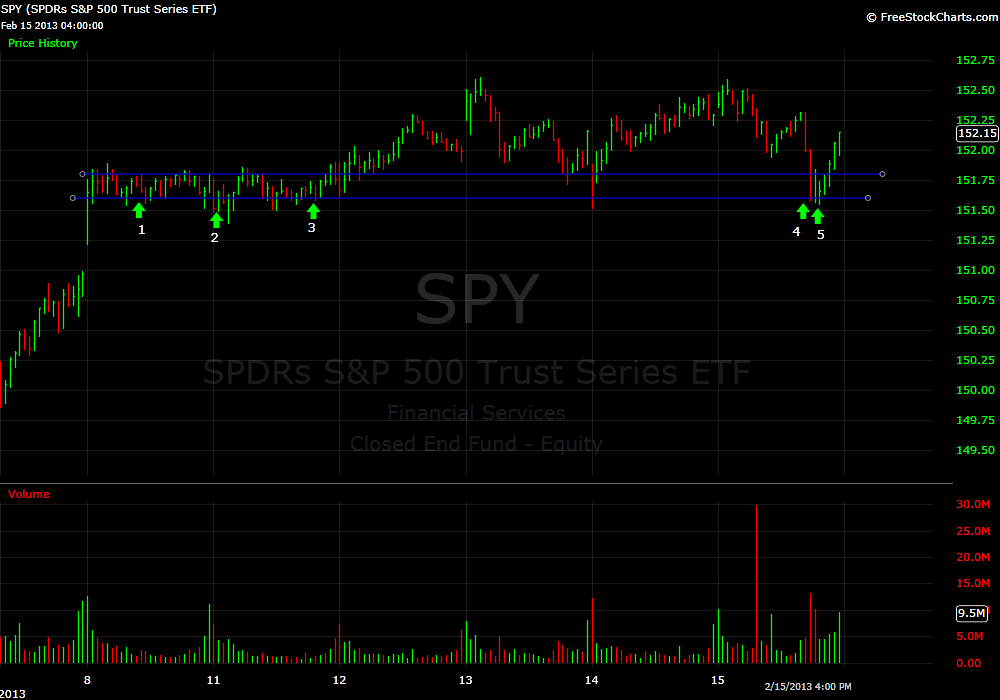
The trade triggered again on February 15th after we began to sell off approaching the most important support level for the prior six trading trays. The level is SPY 151.60. How do I identify this level? I look at a 15 minute SPY chart and visually I try to identify the area where the market has shown the most recent support. You can do this by finding a level where the market may breach on the chart but almost always closes above or right at the level.
In the case of SPY 151.60 there were 18 fifteen minute bars that breached this level but with the exception of 3 they all closed at or above the level. Five of the bars closed exactly at this price. I just took a stab at calculating the probability of these 18 bars closing exactly at 151.60 5X and I came up with about a 1 in 500 chance of this occurring. This level is not some random price. It is a price that when the market touches the computers start to buy.

And for fun lets have a contest for the first person to figure out how I came up with the probability of 5 of the bars closing exactly at 151.60. The first to come up with the solution receives one free month of SMB Trading Tools! You can put your responses in the comment section of the blog. Just come up with the methodology and don’t worry about doing the calculation.
I have received a few questions asking for an explanation on how to execute this trade in the SPY. I think if you are a manual trader the best way to manage the trade is by scaling in near the support level and then adding when the momentum begins to reverse. In the case of the most recent drop bidding in the mid 60s all the way down to 50 cents would have been a reasonable plan.


Steven Spencer is the co-founder of SMB Capital and SMB University and has traded professionally for 16 years. His email is [email protected].
No relevant positions
6 Comments on “What is a Counter-trend Trade?”
Using binomial distribution:
P(X = r) = nCr pr (1-p)n-r
n = 18
the number of times the bars breached 151.60
r = 5
the number of times the price settled at 151.60
p = 0.3333
probability the price settles on 151.60 is 1/3(3 options are above, at, or below 151.60)
P(x=5) is 0.181 which is approximately 1/500…
dont think there is such a thing as a “counter trend” trade because a trend is only determined after the fact.
it’s either you buy at support and sell at resistance, or you follow the momentum of a breakout or a breakdown, i think
So here’s how I believe you determined the probability of 5 of the 18 bars closing exactly at $151.60 to be 1/500:
I just learned this in my college Stats class. You would need to use the binomial formula I believe. Your n is the number of events, your r is the number of success or “yes” & your p is the likelihood/probability of having a favorable/successful outcomes. In this case, your n would be 18 (total number of bars), your r would be 5 (held $151.60 five times), & your p would be 1/3 or 0.33 (looking for exact level as there are a total of 3 possibilities – above, below, or exact). Plugging this into the formula, which can be done easily here – http://easycalculation.com/statistics/binomial-distribution.php -, your final answer is 0.184. This is roughly equivalent to 1/500 or 0.002.
Binomial Formula: P(X=r) = nCr p^r(1-p)^n-r.
Had to look at my old GMAT notes to answer this one. I actually got a little bit less than 1/500
You have 20 different outcomes in each bar. There are 18 bars and you’re asking for the probability of getting 5 bars where each of these 5 bars closes exactly at 151.60. Let’s assume for the question that each of the 18 bars has the exact same range of 20 cents.
You should be able to get the answer by calculating this :
(1/20)^5 X (19/20)^13 X 18C5
This is equivalent to (1/20)^5 X (19/20)^13 X 18!/(5!*13!)
Which is equal to 0.001374473. This is a little bit less than 1/500 but I believe this to be correct. Dunno, maybe I’m wrong.
To clarify.. you are calculating five 1/20 probabilities X thirteen 19/20 probabilities X the total number of ways you can get 5 out of 18 combinations.
nice job by profader! he wins the free month of trading tools. and good follow up explanation as well.
steve