When a momentum stock makes a misstep the market is very unforgiving. A few weeks ago we saw NFLX get hammered dropping around 80 points in a four-day period. This caught the attention of many short term traders. When a stock moves that far that quickly there is a lot of money to be made on the short side but when the selling subsides the risk/reward for a long trade can be very favorable.
One of the oldest clichés in trading is to “not catch a falling knife”. This expression refers to many traders who attempt to get long a stock that they believe has dropped too much in a short period of time and are looking for some type of counter trend move. The reason why most lose money attempting to get long and some actually get wiped out by adding to their losing positions is they fail to wait for a shift in short term momentum and trend.
If you follow these rules you can safely capture a bounce in a stock that has recently been crushed. The trade takes advantage of those who have recently continued to press short bets as well as those who are willing to pile back in once they see a change in the short term direction of the stock.
• Wait until the stock trades to an area where it starts to move sideways. Once a stock starts to move sideways after a large down move it has reached an area where there are enough buyers to support the current price level and this is the first clue that it may turn back up.
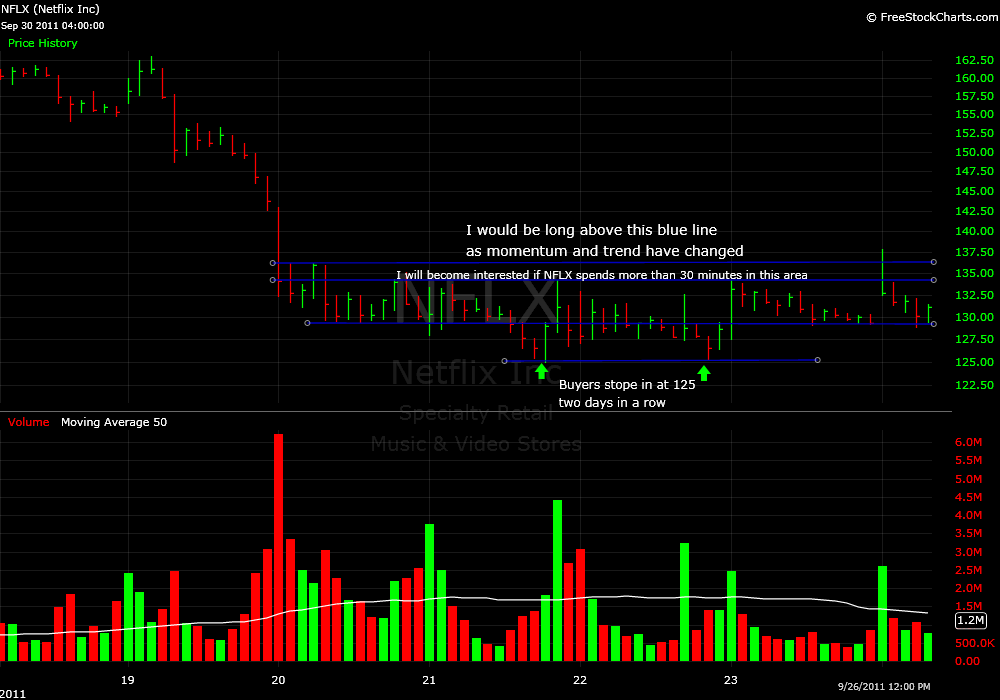
• Take note of areas where the stock is failing to rally above in the new lower range it has established. Once it trades above the upper part of this range do buyers have enough conviction to buy at these higher prices establishing a higher range? If yes, this is where you can begin to initiate a long position. (area on chart between 134.30 and 136)
• Once a higher trading range is established is the next move to higher prices? If yes, this is the beginning of a reversal in trend and momentum and warrants taking a long position. The great thing about this entry is it is based on momentum and so the stop is clearly defined below the breakout entry price (136 line on chart)
I have marked up the below chart in NFLX to show price action that would catch my attention for a long trade. When I look at the chart there are two things that catch my attention in addition to the annotations on the chart.
• The fact that it held the low of 125 on two consecutive days. This put me on notice that the sellers may have run out of ammo and to be prepared for the long triggers above 134.30 and 136
• On 9/26 when it gapped above 136 with the SPY gapping higher it sold off hard on the Open dropping to the prior day’s low despite the fact that the market rallied that day and close at its high. That selloff got me to tweet that NFLX was a weak piece of sh**t and starting to think about what would happen if it dropped the 125 level…


2 Comments on “Looking for a Bounce”
NFLX ran into a cluster area (8 SMA on daily chart and 78.6% fib level -> 137.80)
If you draw fib grid from 9/15 high to 9/22 low the levels will be clearly seen
My set up for NFLX for the next week
Short below 107.50 to 102.20; 95.10; 87.95
I’ll take long above 128.00; to 131.50; 138.20
At least this is what I think, and thanks for the great post
asasasasa