This guest post from experienced futures trader Bruss Bowman provides an excellent example of how to incorporate higher time frame price action into a possible lower time frame trade. It is clear from the post that Bruss in a methodical thinker who is also flexible in his thesis if price behavior fails to confirm.
Reversal Rehearsal: Stock Study in DG
DG provides an excellent price reversal $Study from 12/11/2012 to 12/12/2012. This price pattern occurs frequently across asset classes and time-frames. This strategy and subsequent setups provide a high probability trading environment worthy of study.
After Tuesday 12/11/2012 close, there was a significant probability that DG would trade higher on Wednesday. To determine why let’s start with a daily (macro) chart analysis.
What we know at the end of Tuesday’s trading:
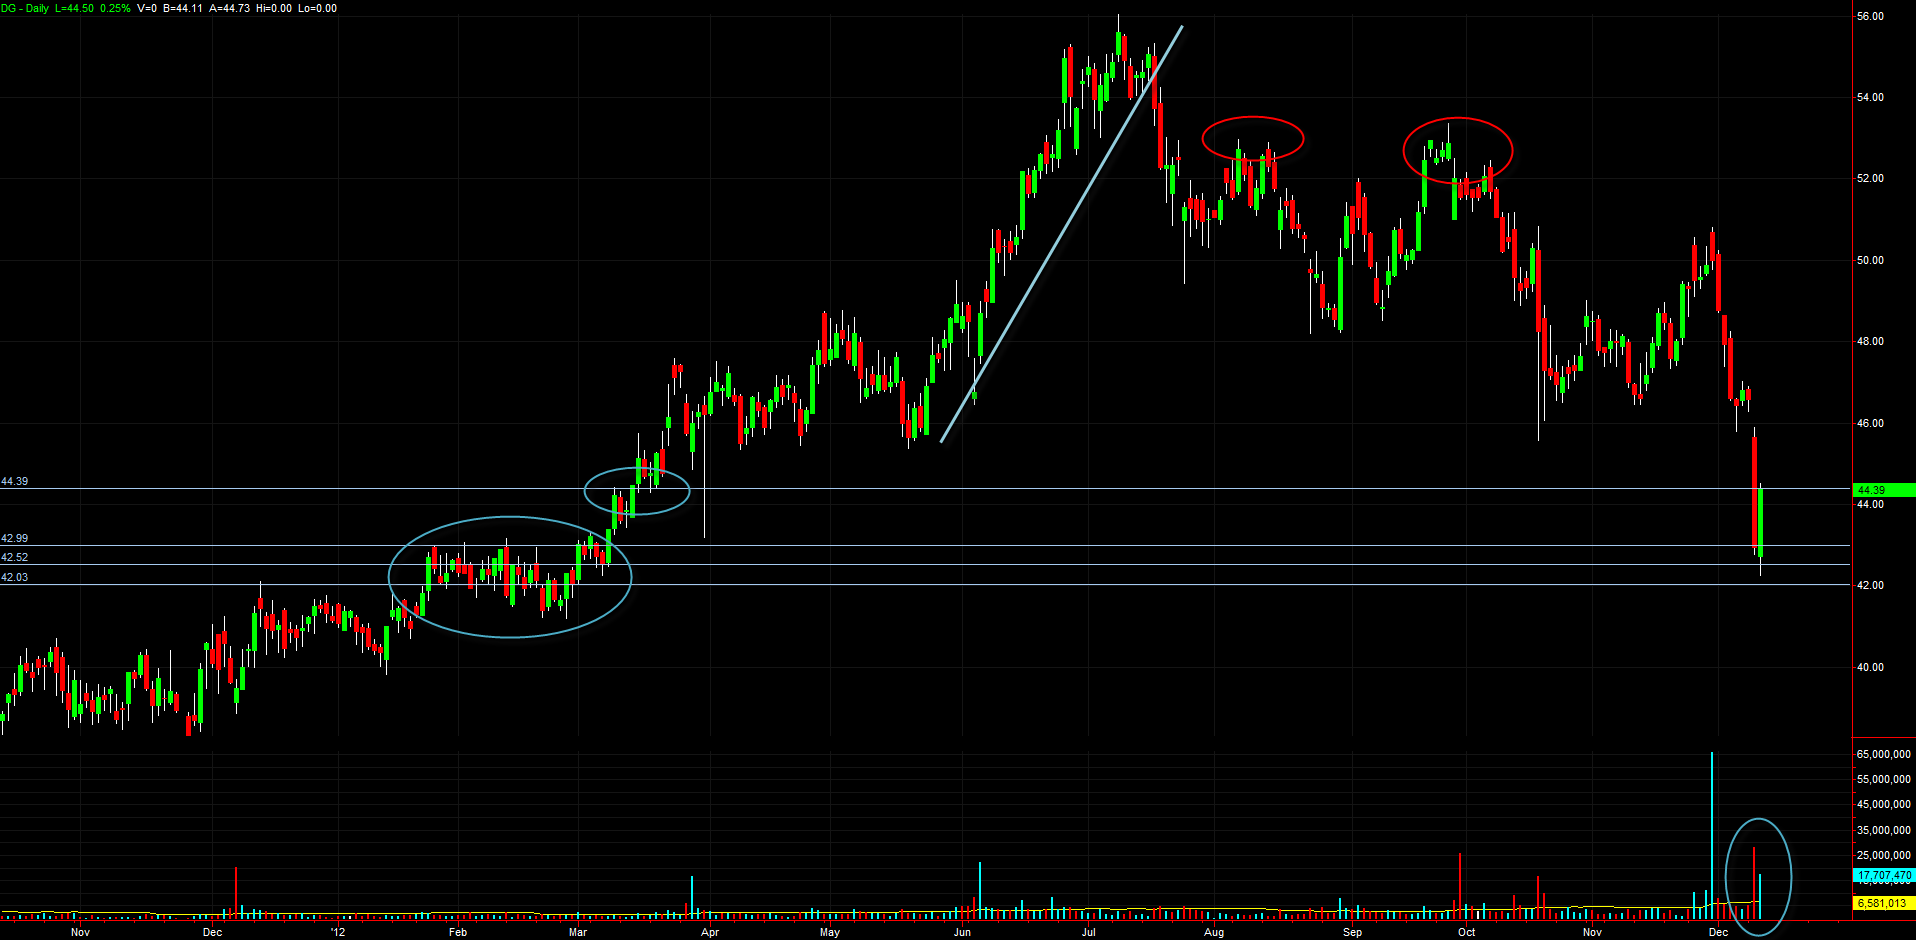
- Price made a 2 month consolidation from January to March ’12 in a tight range
- Price broke out in march for a multi-month run higher, consolidating for several months > 46.00 before accelerating higher to > 54.00 and the high of the year.
- Price broke the daily ascending trend-line (sharply) in July and entered a long term, confirmed, daily downtrend with several lower pivot highs and lower pivot lows.
- In the week prior to 12/11/2012 price strongly rejected an attempt to move higher from 48.00, clearly breaking another ascending trend line and multiple areas of inflection line and pivot support.
- Tuesday’s break of the long term support at 46.00 came on much higher volume and traded in a clean downtrend to the long term multi-month consolidation at 43.00
The reason for all that preliminary information is that it is *all* relevant to the probability that DG would reverse on Wednesday, 12/12/2012.
Price had been in a 5-6 month daily downtrend indicating strong, consistent selling pressure from big money. Price made an accelerated move down in the week prior to Tuesday’s price action, indicating more *urgent* selling. Tuesday’s gap below long term support at 46.00 and very high volume selling indicated even more urgent, capitulate selling. Put yourself *in* the chart, after months of steady selling, price accelerates down for a week and then on Tuesday it really, really accelerates down on much higher volume. If you’re in the chart…who has inventory left to sell here at 43.00? Big money has been getting out of DG since July and now price is sitting right on long term (and substantial) chart support from 42.00-43.00
When thinking about significant price turns my opinion is that:
- Prices stop going down when the asset runs out of sellers
- Prices stop going up when the asset runs out of buyers.
That’s what I look for in the charts.
Therefore, if I look at this chart on Tuesday night I consider that there is a significant probability that DG trades higher on Wednesday because it has likely run out of big money sellers (supply inventory) *and* it is sitting on long term, substantial support.
All this analysis has given us a *strategy*, an asset with a significant probability of behaving in a particular way. This is a *small* although very important step.
What’s next?
Now we need to game plan out various high probability *scenarios* that will confirm our strategy bias and give us likely high probability, high reward:risk trading setup possibilities.
This scenario planning must incorporate an analysis of the long term support details from January-March as well as a detailed analysis of the support/resistance and trend-line levels from Tuesday’s trading. The scenario planning will be unique to your playbook and dependent on how you *see* the market behave at key inflection and trend line levels.
The Jan/Mar support shows inflection levels at 43.00, 42.50, 42.00…note there are more support levels below 42.00 but IMO if price trades below 42.00 then it has invalidated any reversal thesis for Wednesday’s trading.
In Tuesday’s trading there is a *wealth* of price information (see tick chart below and mark ups)
From both the daily and tick chart my partial list of *high-level* scenarios going into Wednesdays trading would be.
- Price gaps > 43.00 buy inflection support setups close to but above 43.00 and 43.50
- Price gaps < 43.00 buy support consolidations at 42.50 or 42.00 (scalp only to 43.00, addback or re-enter if price breaks 43.00 and holds.)
- Price gaps < 43.00 and trades back to that 43.00. 15/5M topping pattern short for continuation move to 42.50-42.00 and beyond (selling not finished scenario)
- Price gaps < 43.00 and immediately snaps > 43.00 and holds, long with larger targets (shakeout scenario)
- Price trades to 43.50 and inflection resistance from Tuesday. Evaluate how price trades to here to determine if sell, hold, short at this level. This level may hold up the long term bias for daily reversal OR not. Similar to 43.00.
Note that I will also tend to do a high level on price extremes as well, i.e. price < 42.00 and price to 45.50
Additional note that my personal scenarios would be much more detailed and include my own short hand for my unique playbook elements for how price sets up at support and resistance levels to provide high odds set ups.
So the five step process is:
- Evaluate the macro charts for a high level strategy. In this case DG is a text book daily reversal play
- Mark up macro and micro time-frame charts with support, resistance and trendline levels
- Develop a high level game plan for the asset for the day’s trading.
- Develop a detailed set of scenarios based on the game plan for the day’s trading
- Update the charts, gameplan and scenarios based on the pre-market, open + 1H trading to further stack odds on your favor for the midday and afternoon trading.
Best,
-Bruss
Daily chart *strategy* analysis.

Tick chart detail of Tuesday’s trading marked up with inflection and a trend line level. It should be *obvious* from this chart you want to be long > 43.00 and longerer > 43.50

No relevant positions