In my last post, I shared a few thoughts about doing market research and analysis. I realized that I probably left two important points unsaid. For me, the whole point of this kind of research is to understand the tendencies of the market you are trading and to find tradable patterns. This is not merely fun with numbers or intellectual curiosity—the whole point is to figure out what patterns in markets might offer opportunities for profit. Doing this work, and seeing the stats, will impress on you how thin the edges really are and you will understand even better why it is so hard to trade.
Another important thought is that there is a behavioral reason for doing research. One of my early mentors pointed out to me (over and over) that, as traders, we think our job is to trade. Nothing could be further from the truth. Our job is to make money, which means that we should not be trading when there is no edge. Too many short term traders click keys all day, in and out, making trades with no real justification. Markets are highly random most of the time and we simply have no edge. Our job is to do nothing and wait for those opportunities to appear, but, trust me, it can make you feel very useless to sit at a screen for hours doing nothing. The temptation to do boredom trades is very great, but this time can be much more productively spent doing research. It’s a double benefit: you understand the market better and you don’t do pointless trades. How can that not be a good thing?!
So, let’s dig into the original reason for this post. First, we should define the question very precisely. A first attempt at phrasing the question might have asked, “what happens after a market gaps on the open”, but even this simple sentence is slightly ambiguous. What market are we talking about? Might the answer be different for stocks, futures, and forex.(Forex? Gaps? Anyone see an issue here?) What about stocks in different sectors? What about different time periods? Do you think gaps might have behaved differently during the financial crisis, the dotcom boom, or the quiet years in between? Define a “gap”. Does it mean an open above the high or above the previous close? What about volume? What about premarket? Does it make a difference if there was a news event? Should we remove gaps due to dividends? What does the original question mean when it says “what happens?” Do I mean the same day or two weeks later? Are we only looking at price or should we consider changes in volume and volatility? Does gap size make a difference? How about any seasonal influences? How do I check all of this to be sure it’s tradeable and that there really is an edge I can exploit? OK, let’s stop there, but I’m just getting started. See how quickly a fairly simple question becomes a little more complex when you think about it?
This part of the process is probably most important. Most people will want to take a question, roll up their sleeves, and start crunching numbers, but it is more important to stop and think carefully before you go down that road. You see how even a very simple question can lead to multiple branches, and how it would be easy to miss something significant. This is why your answers are never absolute truth, and it pays to revisit even simple questions that you think you had completely solved.
Let’s narrow the scope of this question a little more. Specifically, I am interested in knowing what happens to actively traded stocks when they gap outside the previous day’s range on the open. I realize that there is potential survivorship bias (if I take companies that are doing well today, I will have a skewed sample), but I will use my universe of actively traded stocks and rank them by a relative strength ranking. Then I will take a random slice from the top, bottom, and middle of the universe. I selected 39 stocks from my tradeable universe of 500 through a random process (you’ll have to trust me on this one as I’m not going into detail on that). I have decided to look at roughly the last three years (9/26/2009 – 9/24/2010) on this set of stocks, which would be 29,208 trading days. This seems like a large enough sample to get some ideas, though, if I wanted to be sure, I should also look at different sets of stocks in different market environments.
Let’s also define gap as simply opening above yesterday’s high or below yesterday’s low (as I said, outside of yesterday’s range.) Since I am interested in short-term, same day trades, let’s define “what happens” by simply asking if the gap closes on the same day. So, if the market opens above yesterday’s high, I would define a successful trade as the market, at some point today, trading at or below yesterday’s high. The one day gap on a daily chart will have closed at that point.
Before doing anything else, it always makes sense to simple take a look at the data. We find that, in our sample, the market gaps open 7688 days, which means we have a gap 26.3% of all trading days. Very interesting…. seems like a lot. Let’s see what these gaps look like, by taking a look at the stats on all of these gaps:

(The numbers in the output above are in basis points, just because I find it easier for the brain to process bigger numbers. A basis point = 1/100 of a percent, so .78bp = 0.0078%.) The first thing we notice is that the average gap is very, very small only .78bp. It is hardly worth looking at a trading idea on such a small price movement, but we see that there are also a large number of bigger gaps. In fact the 25th and 75th percentiles are about half a percent, so it may make sense to look at the tendency to close across different gap sizes.

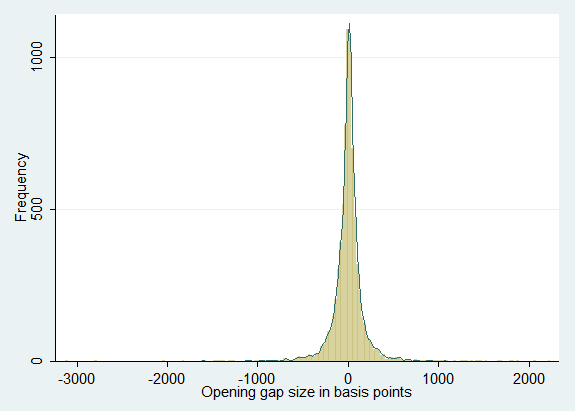
The chart above is another way to look at the data. On the horizontal axis, we have gap size in basis points, while the vertical axis shows how many occurrences of that size are in our sample. Though it may seem like we haven’t really added anything with this graph, it reinforces visually what we already saw in the data: the very large area under the curve around zero tells us that there are a lot of very small gaps in the sample.
Looking at the 7,688 gaps in our sample, we find that the gaps close 5,828 times, which is to say that, in our sample, gaps close 75.8% of the time. Wow, what a tremendous edge to have in the market! So, we’re done, right? Not so fast… this post is part 2 of 3!
One Comment on “Gap Study (2/3)”
is that Stata?! that program looks oldschool!