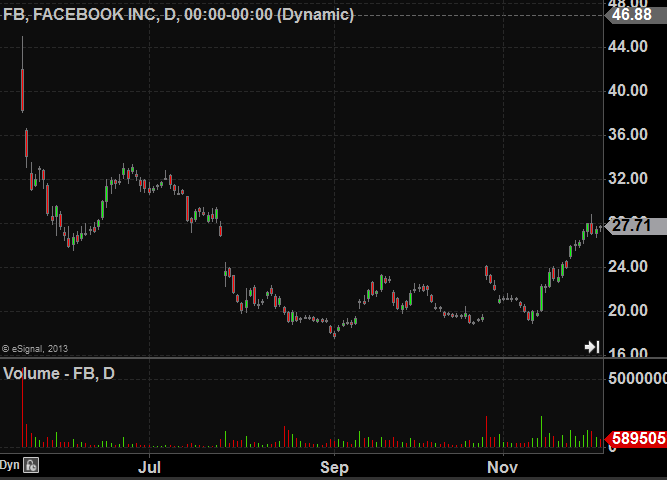
Fundamental Plays

So Simple Yet Missed By So Many

Jun 30th, 2011 | By sspencer | Category: Fundamental Plays, General Comments, Steven Spencer (Steve's) Blogs, Trading Lesson

I have been inspired to write a quick post from a tweet sent out earlier from @apextrader. He mentions that he got long YOKU around 32.50 and that it has gone back up but been a fairly bumpy ride. Why did he make that trade? And why are so few able to execute this trade?

YOKU recently was beaten down with the rest of the Chinese stocks. It finally started to move sideways and then had a clear break to the upside on Tuesday. It broke out from 32.50 and had a monster move to 37.50. Yesterday it trended all the way back down to 32.60 before bouncing 1.5 points into the close.

Today it dropped like a rock to 32.62 and then reversed fairly hard to 33.50 and consolidated for another 30 minutes before it had a second up leg to 34.80.

I think most traders miss these trades for a couple of reasons. One, they just don’t understand how favorable the risk/reward is on buying a stock when it returns to an area where it broke out from. Two, often a stock will look like garbage on the tape when it is returning to a breakout price and traders may wait for some confirmation that the stock isn’t going to steamroll them the second they get involved.

Here are a couple of tips to make this trade easier on your nerves. Only go in with a quarter position size as it approaches the breakout price. And only start to build the position size once the trade has moved in your favor and had a chance to consolidate.  As a rule of thumb you want at least 25 minutes of consolidation prior to building up your position.

Post to Twitter Post to Delicious Post to Digg Post to Facebook Post to Reddit Post to StumbleUpon


A Missed Opportunity

Oct 18th, 2010 | By sspencer | Category: Fundamental Plays, General Comments, Steven Spencer (Steve's) Blogs

A quick note on an error I made this morning in our AM Meeting.  We begin the meeting with an overview of the market and then discuss stocks with fresh news.  During earnings season there are a ton of stocks with fresh news so I try to limit it to five names.  Stock number six on my list was MMR.  It was gapping down in the pre-market below 18 Where it broke out from a couple of weeks ago.  One of my favorite setups is seeing how a stock will react when it gaps above or below a key breakout price.

After the market opened MMR traded up to 18 three times.  After 18 failed to lift on the third occasion large selling came in and drove it down almost two points.  Remember this setup as we move forward during earnings season.  If you spot a stock gapping away from a recent breakout price make sure you set alerts if it returns to that price.  It is a high probability trade with an excellent risk/reward ratio.

Post to Twitter Post to Delicious Post to Digg Post to Facebook Post to Reddit Post to StumbleUpon


What A Difference A Day Can Make

Oct 5th, 2010 | By sspencer | Category: Fundamental Plays, General Comments, Steven Spencer (Steve's) Blogs, Trading Psychology

After a pretty hard down move in the SPY’s yesterday we gapped up today and never looked back.  Today’s action reminded me a bit of September 24th when we gapped above 113.60 SPY and never looked back either.  On September 23rd there had been some vicious selling but we held the 112 support area.  Yesterday we held 113.20.  As Brian Shannon (@alphatrends) likes to say often when reviewing his charts “the market put in a higher low and today it established a higher high. price pays!”

One of the most difficult skills to master as a short term trader is to be able to change your bias at a moment’s notice. Yesterday, as we powered below 114.40 my mentality was to be short.  This morning when we gapped above 114.40 my mentality was to look for the upside break.  One potential roadblock that traders face when developing the skill of being able to quickly change their mentality is being punished for doing so.  For example, when we started to power lower yesterday if the market had quickly reversed to the upside and I had been caught short then perhaps I would have been reluctant to trade on the long side today.   And if today I loaded the boat when the SPYs consolidated above 115.40 and we had tanked then that cause me to be hesitant the next time we set up for a similar move.  But at the end of the day if we aren’t able to “do the right thing” we will not survive as traders.

To illustrate how quickly things can change I have included both yesterday and today’s intraday charts from BIDU.  I was happy to see at the end of the day today that many people made money trading it on the long side.  This is following a day where our traders were almost exclusively trading it on the short side.  That type of mental flexibility bodes well for the young traders on our desk.

Post to Twitter Post to Delicious Post to Digg Post to Facebook Post to Reddit Post to StumbleUpon


Major Market Sectors and Money Flows

May 3rd, 2010 | By Adam | Category: Fundamental Plays, General Comments, Trading Theory

I thought I would kick off the month, and my blogging at SMB, with a look at major market sectors and money flows between those sectors. I will also share an analytical tool I have found useful when trying to understand sector strength and rotation.

Though there are a few competing standards, the market is traditionally broken down into 10 major sectors: Energy, Basic Materials, Financials, Consumer Discretionary, Consumer Staples, Technology, Telecom, Utilities, Health Care, and Industrials. (A good reference can be found here.) Some of these sectors are considered defensive, meaning that money will usually flow into these sectors when investors are feeling risk-adverse. The thinking is that people are going to need electric power, toothpaste, cleaning supplies and telephone service regardless of the condition of the economy, so these companies should be relatively (key word) insulated from a downturn in the economy. Cyclical stocks have more natural exposure to the business cycle, and may be considered more or less speculative, as money will often go into these sectors when investors are feeling confident and are seeking outsized returns. This is, of course, a gross oversimplification, but it is important to keep this framework in mind.

Most textbooks will tell you that there are only three defensive sectors: Consumer Staples, Utilities and Telecom. I would argue several points:

  • Telecom now includes an ever-increasing percentage of cell phone and wireless data service which may introduce an element of cyclicality, making this sector less defensive.
  • Healthcare probably occupies a gray area between defensive and cyclical.
  • Many people think that movements in Materials, Industrials and Energy stocks have great forecasting power for the future of the overall economy. I would argue that most of these companies are very good at hedging, which smooths out their revenue streams and reduces their usefulness in this regard (and also, by the way, reduces their exposure and sensitivity to the price of the underlying commodity).
  • There are degrees of cyclicality. Retail stocks and consumer discretionary in general are probably ultra-cyclical. The surprising resilience of many consumer stocks through the financial crisis of 2007-2009 (TRLG, BKE, BID, etc) was, to me, a clue that the stock market was probably going to recover faster than most people thought likely.

To understand sector rotation and money flows, it is important to consider sector movements relative to each other and to the overall market. That consumer discretionary stocks are up 20% over a specific time period tells you nothing. What if the broad market was up 30% or down 5% in the same time period? A completely different picture. I have found it useful to create spread charts for each of the sectors by dividing the price of a sector index (the S&P Sector Spyders such as XLE and XLF are useful for this purpose) by the price of a major market index such as the S&P 500. The result is a line that shows the relative performance of each sector to the S&P which immediately highlights strength and weakness between the various sectors.

The chart above shows the performance of the nine S&P Sector Spyders (Telecom is merged with Technology) relative to the S&P. Each dot on the red line is a separate trading day, the black line is a moving average which shows the longer-term trend of over/under performance, and the light colored bands show when the relationship has reached an extreme level. Though this page was produced in TradeStation, you certainly could build these charts in Excel using free data available from Yahoo! Finance. Several points are interesting:

  • Consumer Discretionary, Financials and Industrials have led the market for much of this year, while Utilities and Consumer Staples have lagged. This is precisely what we would expect if the bulls are feeling confident.
  • The defensive Staples, Utilities and Health Care have lagged the recent (March – present) drive in the market. This also is consistent with investor confidence.
  • The pounding that Financials took following the GS news is very obvious on these charts. The XLF/SPY spread completely traversed the overbought/oversold bands within a week, which is an unusual move.
  • Consumer staples and Utilities strongly outperformed the broad market Friday.

This last point really caught my attention as I did my review over the weekend. We know the market has been in a mode where every dip has been bought with confidence, and shorts have generally been punished quickly and efficiently. A lot of guys on our desk have correctly observed that, for the past few months, the market pretty much does nothing but go up. This week was different. We finally saw a break in this pattern as we had several days where the market was unable to lift off the lows and closed down on pretty good momentum. For the first time in a long time, the sellers seem to be in control. The question now is, is this the beginning of a downturn that will last several weeks to several months, or can we expect to quickly recover and head to new highs? There are certainly good arguments on both sides of the fence, but I would suggest that, if we are going to turn back up quickly, we should not see sustained money flows into defensive sectors. Friday’s strength in Utilities and Consumer Staples is another warning shot for the bulls.

Post to Twitter Post to Delicious Post to Digg Post to Facebook Post to Reddit Post to StumbleUpon


SEED money for the New Year

Dec 30th, 2009 | By Dov | Category: Dov Quint (Dov's) Blogs, Fundamental Plays, General Comments, Trading Ideas

There’s always something to trade. You just have to be where the volume is. It can take one good stock to make your week, and one good week to make your month. 90% of life is showing up, and for those who showed up today, there was money to be made.

We had a repeat offender today, our good old buddy Origin Agritech, ticker SEED. Maybe there’s a hedge fund out there that needs to save their entire year by driving up this stock. Maybe there are some new algorithmic programs being tested out to see how far they can take a small cap stock for a ride. Whatever it is, when a stock moves 30% on volume that is more than the entire float, there is going to be some money in it. Forget that it’s the day before New Year’s Eve.

I suppose one advantage of the rise in algorithmic trading programs is that even on a day like today when a lot of traders are off their desks, the programs can still do as much volume as they want. The computers aren’t taking away skiing or sailing, nor are they too hung-over from partying all night to trade . If they want to drive a stock up, it doesn’t matter how many other traders are on vacation, they will be able to drive it.

Post to Twitter Post to Delicious Post to Digg Post to Facebook Post to Reddit Post to StumbleUpon


Do Not Give Up On The Best Setups

Jan 31st, 2009 | By sspencer | Category: Fundamental Plays, Steven Spencer (Steve's) Blogs, Trading Theory

There are several setups for intraday traders that offer the greatest risk/reward.  An essential part of our job is being able to identify these setups and not to abandon them if they fail to reap a reward initially.  One such setup was offered in CAT this past week.  CAT gapped down on abysmal earnings.  It spent several days flirting with breaking down below 32.  But it just wouldn’t break down.  The first few times it dropped 32 it wouldn’t stay below for very long.  And on Thursday when it finally cleanly broke below 32 it only dropped 30 cents.  31.70 became a support level.

There were several traders on the desk who got ripped up around the 32 level.  All of the bids at 32 would get hit out so many traders would get short to play the momentum.  But CAT would trade back above the 32 level every time.  At this point as a trader you need to make an adjustment.  You can no longer short CAT unless it trades below 31.90.  You need this extra confirmation of the downward momentum before establishing a short position.

Some might ask why I would continue to maintain a short bias in light of the fact that CAT failed to break down for several days.  The answer is simple.  One,  stocks that gap down on poor earnings and fail to bounce significantly that day trade lower in the trading days immediately following the gap down.  Two, stocks that consolidate near the low after a large gap down usually get hammered once they drop below the consolidation range.  Three, under current market conditions stocks that are set up to trade lower do so over 80% of the time.

On Friday, CAT opened below the 31.70 support.  After briefly popping above 31.70 it dropped to 30.  I have to admit that I missed this trade.  It would be easy to say it was the end of the week and I just wanted to focus on AMZN.  But the reality is that I had been waiting for CAT to break all week.  I should have seen that it was opening below 31.70 and set an alert for 31.70.  When it failed to stay above that level I could have put on a small short position since it wasn’t my primary stock for the Open.  The first time I looked at it on Friday was at 30.10 when my alert that I had set earlier in the week was triggered.  I set that alert on Monday expecting that when CAT eventually broke hard below 32 that it wouldn’t stop until 30.

At the end of the month if you fail to make these high reward low risk trades your results won’t be nearly as good as they should be.  It is understandable that some may become frustrated if their setups don’t work as planned initially.  The proper response is to make the adjustment to your plan and put the trade on when your new criteria are met.

cat

Post to Twitter Post to Delicious Post to Digg Post to Facebook Post to Reddit Post to StumbleUpon


The Box vs. The Big Picture

Nov 17th, 2008 | By sspencer | Category: Fundamental Plays, General Comments, Steven Spencer (Steve's) Blogs, Technical Plays

I was at the office Sunday doing some admin stuff and working on some trading prep for this week.  One of our Senior Traders was at the office reviewing some trading videos as well.  He had a question for me about how he could trade the large reversals we have been seeing in the market more effectively.  He is a consistently profitable trader who rarely has a negative day but seems to have difficulty capitalizing on larger market moves.

At SMB we teach our traders to pay careful attention to the price action on The Box.  The Box is where all of the bids/offers for a particular stock are aggregated and give a trader clues to the level of buy/sell interest at any given point in time.  As traders become more seasoned they are able to more effectively discern what is happening with The Box and their win rate for their trades increase.  But there are occasions when a trader needs to place less emphasis on The Box and have a better understanding of what the big picture is for the market at the time.

On Thursday we moved through the S&P and Dow lows in the early afternoon.  There was a powerful up move in the market from the intraday lows.  I faded this first move as I believed that there wasn’t enough capitulation to establish an intraday bottom.  After I established my short position  the pullback was very shallow and didn’t come close to threatening the intraday low.  The next upmove was extremely powerful.  At that point my bias changed to the long side.  My initial fade of the market cost me many thousands of dollars.  Once I established a long position I made my losses back in less than 10 minutes.  This was the next powerful clue that the market was truly reversing and had a significant amount of upside for the final two hours.

It was time to adjust my normal trading style.  Under normal circumstances if I were long the market and The Box began to indicate weakness I would hit out of my long position very quickly.  But if the Market gives me an indication that something out of the ordinary is going on I will maintain my long position and look for opportunities to add to my position-even if The Box temporarily is contradicting my bias.  It is a question of risk vs. reward.  Market volatility is at all time highs.  If a reversal is occurring then my upside in the market is 5-10% so I am willing to give my positions more room on the downside.

Once I have established a bias towards a large market move I am constantly looking for evidence to support or reject my thesis.  On Thursday every time I would hit out some of my long position when The Box indicated weakness I ended up paying higher prices to buy back the stock I had just hit out.  Every time a recent resistance level was breached the market moved higher quickly.  Every time the quotes on The Box slowed an unusual upmove in the market would soon follow.  These were all things that led me to believe that a significant bounce was occurring.  After each significant pullback in the market occurred I got long and each time I was rewarded.

Finally, around 3pm I bought into significant pullback but the market continued to move lower.  The buyers had all disappeared.  At this point I had given back a huge portion of the money I had made in the bounce.  I commented to the traders in my row that this last downmove seemed irrational and it was still possible the market would move to the highs and close at the high for the day.  During the next 15 minutes the market moved to the previous highs.  Once the market moved above the intraday high it continued to move higher and never looked back.

The large mistake I made in the final 30 minutes was not staying long until the market closed or at least had a significant vertical upmove that would signal a temporary top.  My mind was still placing emphasis on the downmove that occurred at 3pm that had breached the previous uptrend.  I was up a lot of money and didn’t want to get caught in another vicious downmove.  My emotions trumped reason and I was unable to fully capitalize on the final upward spike in the market.  Usually, when I fail to capitalize on a trading opportunity it doesn’t bother me because I know that I have gained valuable trading knowledge that will help me in the days to come.

The following day I was down in Philadelphia doing some OCR.  I sent an email to one of the traders in my row who also trades the SPY’s.  I gave him two potential buy prices for the SPYs: 88 and 87.20-.87.30.  These were prices based on the previous days action that I believed would offer great opportunity on the long side.  The trader mentioned to me in an email that he had already capitalized on the 88 level in the morning.  If you look at the chart below you can see that the SPYs bottomed in the early afternoon around 87.25 and rallied over the next 2.5 hours to 92.  How did I pick this inflection point?  It isn’t something most traders would pick out when looking at the chart.  If you look closely at the SPYs chart you can see on Thursday that 87.30 was the beginning of the final down leg that violated the bounce trendline.  This was the price that created the final shakeout for short term longs who were looking for the market to close at the highs on Thursday.  This powerful downmove below the bounce trendline probably kept a bunch of traders away from the longside at the end of the day.  But it was information they could use the following day to make a huge chop!

That is the beauty of the market.  Recent observations of the markets’ patterns and price action will help you to develop a trading edge.  So much for the efficient markets hypothesis :)   SMB has over 12 years of data that directly contradict that academic line of thinking…

Post to Twitter Post to Delicious Post to Digg Post to Facebook Post to Reddit Post to StumbleUpon


My Case For A Market Bottom

Nov 17th, 2008 | By Gualberto | Category: Fundamental Plays

I think Thursday may have been the lows we may see this bear market.  Obviously, nothing is 100%, but I’m seeing things that have made me feel a little safe to start getting long at these levels.  And if we break these lows, I really don’t know where support is.  But I think the risk/reward is worth getting long at these levels.

My reasons:

  1. One thing we always stress on the desk is to recognize patterns.  On the Level 2, on the chart.  Wherever you can spot something to gain an edge.  I’ve seen plenty of bear and bull traps since I’ve started trading.  If you take a look at the SPY chart over the last 6 months, you will see that the 84 area was established as a level, with 83.50 being the support from October.  On Thursday, when the SPY broke these levels, selling accelerated.  The SPY traded down to 82, then stopped, and reversed hard to the upside.  This is a bear trap.  You have to figure that people getting long after the October 10 lows were setting there stops right beneath those lows.  So when 83.50 was breached, the stops were set off that caused people to get out of their positions.  Aggressive traders were shorting below those lows expecting a vicious downmove.  Instead, there was a downmove to shake out the weak hands,  followed by a very strong upmove.  I’ve seen patterns like this occur so much intraday.  Clear levels are established.  They are then violated.  They then reverse strongly to the other direction.
  2. I used to watch Fast Money religiously.  I stopped watching because with the exception of Macke, almost everyone on the show was bullish.  I could understand since they’re owned by GE, and I’m sure they are probably mandated to be more long than short oriented.  But I watched the show on Thursday after the close expecting them to say that the rally was a sign of great strength, and they were all without exception advising to sell the rally.  Another point: Nouriel Roubini, an NYU economist, who saw all this coming down the pipeline in 2006, has been on CNBC only a handful of times during the first 9 months of the year, has been on the network about 3 times since October.
  3. Intel lowered its earnings guidance Wednesday night after the close.  Inital claims came in significantly higher than expected Thursday morning.  There hasn’t been one shred of good news coming out.  The market isn’t making new lows on all this news.  This is different than even a month ago, when just a rumor of something would cause a significant sell off.
  4. China.  Watch the Chinese stock market for leadership.  In February 2007, the Chinese stock market sold off sharply in one day, causing a worldwide selloff, sending out the warning shot that not all was well in equity markets.  When worldwide markets topped out later in the year, China was the first market to top.  Over the last two weeks, China has showed strength, even when worldwide equity markets have shown weakness.  This is a divergence to take note of.  FXI has been much stronger than the SPY has been over the last 2 weeks.
  5. Bill Cara posted 2 charts where he compares this bear market to the 2 most severe bear markets since the Great Depression.  Both the 1973-74 bear and the 1987 bear are very correlated to this bear, and suggest that an end could be close.
  6. But even if the US economy goes into a long recession, there will still be opportunity for upside in the equity markets.  On October 13, in his Daily Report, Bill Cara pointed out the returns during the Great Depression that equity traders were able to take advantage of.
    • June 1, 1932 – Sept 7, 1932: 111.6%
    • Feb 27, 1933 – July 19, 1933: 120.6%
    • Oct 19, 1933 – Feb 4, 1934: 37.3%
    • Mar 14, 1935 – Mar 5, 1937: 131.8%
    • Mar 31, 1938 – Nov 14, 1928: 62.1%

We could end up breaking lows this week and starting another downleg.  I’ve been reading many articles lately by Elliot Wave technicians that are indicating we have one more downmove to go.  But for all the reasons I listed above, I feel more comfortable with being long at these levels than being short.

Post to Twitter Post to Delicious Post to Digg Post to Facebook Post to Reddit Post to StumbleUpon


Find the Easy Plays

Nov 13th, 2008 | By sspencer | Category: Fundamental Plays, General Comments, Steven Spencer (Steve's) Blogs

Trading is a tough profession.  Every day you need to figure out a way to make money.  During the first couple of years of your trading career it is important to be in the easiest plays.  One such play involves getting long above a recent support level in a stock.  The more recently the level was important as support the better a trade it will be for an intraday trader.  Also, it is a better trade if the stock has had a significant move off of the  price level.  Once I become aware of an important support level I will set a price alert on my platform.  If the stock gets to that price again I will make a trade.

Last week CHK was In Play because of the BP takeout rumor.  The day after it ran up to 26 there was profit taking.  In the afternoon CHK touched $22 and bounced 1 point.  I set an alert on my platform the next day for $22.10.  When CHK got to $22 I got long.  It never traded below $21.94 (my stop was below $21.85) and popped to $23.50.  I made a huge chop.  One other trader on our desk who mentioned this important level in our AM meeting also made a chop.

The next day I mentioned this trade in our AM Meeting.  I was disappointed that more traders on our desk hadn’t taken advantage of this “easy money”.  A couple of days later CHK bounced off of $22 again.  At the end of the day when I was checking our desk’s numbers it was nice to see that over 30 traders had placed a trade in CHK.

When you are a young trader who is working on developing your craft please do yourself a huge favor and don’t pass up on these great risk/reward opportunities.

Post to Twitter Post to Delicious Post to Digg Post to Facebook Post to Reddit Post to StumbleUpon


Is the Dollar Strenght Sustainable?

Aug 17th, 2008 | By gman | Category: Fundamental Plays, Gilbert Mendez's (Gman's) Blogs

As I have mentioned in my bio, I have been trading currencies for quite a while. I do not miss getting up at 1am EST to get ready to trade the London session. Yet, these days with the current violent moves in currencies I find it hard not to sacrifice an hour or so of sleep to put a day-swing trade in the EUR/USD pair.

During the past 2 weeks we have seen a considerable move in the dollar against the major European currencies. The violent move across the board appears to indicate that the fundamentals are changing for the Dollar. From a technical perspective the 2 year downtrend in the dollar index futures has been breached (see the chart below).

dollar-index-chart.bmp

Obviously the important question is whether this move is sustainable. I do not really have an answer for that one, I welcome comments. But as trader the recent strength in the dollar has created a great fade opportunity in the EUR/USD. The pair is approaching a long-term uptrend line and considering the ridiculous move, (1.56 to 1.47 in 2 weeks) I find it hard to believe that we will crack that line the first time around. So I’m looking to load up around the 1.4630-1.4650 area and looking to hit if we go through 1.46. If the dollar index holds the 77.90 area then I’m going to really load the boat.

eurusd_weekly.bmp

So how does this help me with my equities play this week? Well, if the volatility is maintained at these high levels in the currency markets I expect a bit of action in the Gold and Oil sectors. Perhaps a weaker dollar move will lead to a bounce in oil and thus the beaten down oil services stocks. Regardless of how my dollar play ends up, it should be a good trading week considering that it is summer time. Get ready for some free money!

Post to Twitter Post to Delicious Post to Digg Post to Facebook Post to Reddit Post to StumbleUpon