I tend to write from a more theoretical perspective in these blogs, but today’s market action provides a few interesting lessons. By way of background, I have not been happy with my trading performance over the past few months. I am just not achieving the level of consistency in my intraday trading that I know is possible. In response to the frustration I have been feeling, I have scaled back both the size and scope of my trading and am now focusing on the broad market by only trading a few hundred shares of SPY at a time. (This is also a return to my days when I traded S&P futures exclusively. In this post I will speak in S&P futures points, where each ES point = .10 in SPY.) My focus over the past several weeks has been working to refine my practical application of the interaction of smaller and larger timeframe patterns, but always using the patterns to get to an understanding of the relative balance of power of the buyers vs the sellers.
(I started writing this to illustrate one simple pattern, but as I’m writing, this post spiraled a bit out of control. I find myself mentioning quite a few other patterns that are also important, and I think this post actually became pretty good illustration of a pure technical version of Bella’s “What’s in your circle?”. Technical trading is never as simple as “see this pattern then buy”, but it’s more about seeing evolving market structure to try to understand how the relative balance of buyers and sellers is playing out. I ended up numbering all of the smaller patterns with numbers in parenthesis, just to highlight what I think are the important, relevant, and repeatable patterns.)
-The big gap up on the open is a welcome sight in late summer, because it sets up a high probability for a directional day(1). Finally. I know most true gaps (today’s open outside of yesterday’s range) tend to fail(2) and at least to fill a significant percentage of the range, if not all. However, I also know that bigger picture the (cash S&P) market has tested support at 1,040 three times over the past two weeks, with good price rejection at the level, we put in what looks like a significant higher low on the hourlies, and there was some strange buying after the close. In addition, I know what happened overnight with economic released from Asia, but more importantly I saw the price action in those broad equity indexes overseas. My bias is strongly up for the day, but there’s too much potential for a 5-8 point flush on the open to ignore that possibility, so I have to trade what I see as the price action evolves.
-I actually shorted the new lows about 10 minutes into the day, but was very aware that a standard pattern is to drop the lows, trap some bears, and then go screaming to new highs(3) early in the day. You have to take the short because there is too much good downside potential, but you have to realize it is probably a trap so it puts you in an interesting state of mind. I also know potentially significant (in retrospect, that turns out to be a humorous understatement) reports at 10AM today so I will not be holding my full size into those reports, regardless.
-The short was short-lived. Flipped long a point and a half above my entry a few minutes later as the market held the lows and took out some swing points to the upside(4). Nice little ding to start the day, and of course the potential for being round-tripped now, but you have to do the right thing regardless of how you feel about it. Sold enough of my longs into the rally to be very small in front of the number.
-Now we get the real fun: A huge rally off the number… 10+ S&P points in a single 5 minute bar. I know two things: this is unsustainable behavior so it is probably some kind of buying climax(5), but anyone thinking short after what has just happened, is a complete idiot. I will hold my small remaining long until I see clear reason to get out, and then will reestablish lower. I also know that a giant climax after a gap up like this can easily leave us rangebound in a tight range for most of the rest of the day(6), but I know there’s a very good statistical edge for that range to resolve the upside(7), if not today then tomorrow morning. I also know that, even though people like to think about measured moves, the probability of having a clean measured move off of a climax bar like this is rather small(8), so I will have to be happy with a smaller upside target. I make a mental note to only short today if I see clear and sharp downside momentum (which never happened).
-Now we get the reason I originally started writing this blog. A very common trend-ending pattern occurs when a market makes three symmetrical pushes (on any timeframe). Depending on how extended the trend is, you may start thinking countertrend, but at least you must be very, very careful about holding with-trend positions through this pattern. The pattern grows out of the standard ABC wave, which itself is a continuation off of a strong impulse move. When you see the three pushes, it just means that the normal trend leg has reached its expected target. This is a good warning to not press with-trend positions. Schematically, the pattern looks like:

3 Pushes: A common trend-ending pattern
As I was holding my long position, I saw the S&P market make 3 symmetrical pushes to new highs(9), the last of which came at noon, which, as we know, is a common inflection point(10). I was quick to get flat after the inside bar following the third push resolved to the downside(11).

3 Pushes ended the first trend swing up in the S&P today
3 Pushes to End a Trend is a form of buying climax. I know that there is a chance that this is an actual end of trend which may be followed by a reversal(12), but I also know that I will have to see real weakness before even thinking short(12a?). For now, the highest probability play is a substantial pullback to work off the overbought condition, and at least a retest of the highs later in the day(13). I re-establish my long position at the 20 period EMA which simply provides a reference for a point of relative balance in an overextended market(14). After a very sharp move, the first pullback to the moving average is always worth a shot. In addition, we see a “ragged bottom” which is a sign of classic Wyckoff-type accumulation(15). Intuition tells you you would rather buy a clean test of support, but intuition is wrong in this case. Every little test below support was immediately met by buying pressure. We rallied a bit off that support, so the first pullback is another good spot to add to your position(16).

So now I’m feeling pretty good about myself, and am positioned fully long (ok… fully long and then some) as the market is pressing against new highs at 2PM. Considering the structure of the day has been a very sharp up move, a long sideways consolidation with good accumulation, I know there is a very high probability of another leg up in the afternoon, and probably closing on the highs(17). In addition, I see the market pressing against new highs at 2PM, which we know is the ideal time for a breakout(18). I use this as justification to be overloaded on my long position (mistake #1).
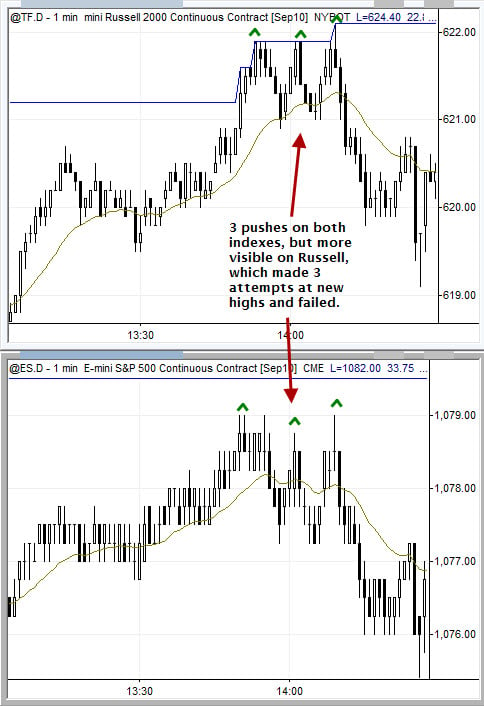
I realize that the Russell is rallying harder than the S&P, which you can see on the chart below by noticing that the Russell is lifting farther off the EMA than the S&P on rallies(19). If there was any doubt about which was stronger, the Russell makes 3 attempts to take out the high of the day while the S&P is holding well under. This is a form of divergence. We want to see all indexes taking out the highs at the same time for the highest probability of a good rally. If we see divergence, it significantly reduces our confidence in the rally(20). In addition, I can see clearly on my 1 minute chart of the Russell that the Russell just made 3 pushes to new highs (you might call it some variation of a triple top), and failed fairly dramatically. This is bad, bad, bad for long positions(21), but I decide to hold my larger-than-full-size position a bit, just to give it a little more room. (This is mistake #2, and you don’t need three to do damage.)
The blue line in the chart below is high of the day for both indexes. Notice how clear this pattern is, but I ignored what I knew was a very high probability pattern. This is fighting the market, and it is pretty stupid… and the way to really do it right is to do it on larger-than-full-size! Ugh. I took a nasty ding out of what had been a pretty good day up to that point. The market is pretty efficient in punishing mistakes and stupidity. Of course, the right thing to do was to have sold at least the extra size at the first sign of weakness, to have gotten very small on the 3rd push failure, and to have at least taken the rest off at breakeven.

3 Pushes and divergence at the highs: Mid-day breakout attempt DENIED
The day eventually did break to new highs, which is an important reminder that these trend-ending patterns do not mean the trend is going to reverse. I did not repeat my mistake and ended the day with a decent profit for the size I’m trading, but easily gave half my day away with one stupid mistake — trading against a high probability pattern.
7 Comments on “Identifying the ABC Trading Pattern: A Key Trend Reversal Indicator”
I made the same trade today I should have exited at 1079 on the high tick as I saw Nasdaq did not confirm and volume in XLF was not there, but I held on hoping for the trend day to continue up. That should have been my que to exit; as every time I hope for a trade to go as planed instead of reading what the market is telling me it inevitably fails. Fortunately, I had my stop loss in place and took a small gain, but I could have executed better. Nice to see I’m not the only one making these mistakes also encouraging to see I’m looking at the market in a similar respect to more experienced traders.
THX for the post very helpful for reflection and continued learning.
Great analysis. Thanks, best one I read in my trading career of 9+ years. Can you please provide print option so that I can print this article and read it quite often.
Appreciated very much for taking time to share it with us.
Damn good read. Thank you for sharing.
@TraderAndyM; yeah you don’t ever become immune to mistakes. best advice i ever received on the subject was if you are going to do something stupid at least do it on smaller size. doing something stupid on larger than max size is… well use whatever words you think appropriate.
@gm: thanks. i dont have another copy i just write directly to the blog. there are several good programs that can print pdf’s directly from a webpage.
@dbh: thanks and you’re welcome.
nice job of explaining trading on a trend day!
To use BIDU as an example from Friday’s action. Can the three pushes form a triple top instead of higher highs and then failing? I am referring to the failure of the 100 level and three pushes to an end forming a triple top around 100.50. Thx.
Would you say GLD is having a 3 PUSH trend end during this early december 2010 rally>