One of the most important questions in trading is “will the support/resistance level hold or fail?” (One of the other very important questions is “is this market trending or in a trading range”, but these are really the same question because trends repeatedly break support/resistance and support/resistance holds in trading ranges.) Many traders do not realize that there are some very characteristic price actions associated with levels holding or breaking, and, more often than not, it is possible to tell in advance what is likely to happen around a level.
The key element of price action in a support level (I will write this blog dealing specifically with support, but everything applies equally well to resistance) is price rejection at the level. Simply put, as the market comes down to the level, buyers immediately step up and push the market away from the level. It feels (and it is not inappropriate to talk about subjective feelings in these discussions) like the market does not want to be at the level and there is a move away from the level very quickly.
On the other hand, if the market is able to go quiet and dull at support, there is a much higher probability of the level failing. The fact that the market is able to trade at or near (whether slightly above or below) support usually presages the level breaking and price trading through.
A few other points to consider: Words like “soon” and “immediately” must be taken in context of the timeframe, which is why some traders prefer to think in “bars”. If the level is an important multi-year level, price may well do work around the level for many weeks in a successful test. On the other hand, tests of highs and lows of the previous day in individual stocks usually see price rejection within 5-10 minutes if they are going to hold cleanly. Second, anything can happen in the market at any time. Never think that something will happen or something has to happen, because the best we can do as traders or analysts it to define the most probable outcome. Even if we are very good, and are working with a very high probability pattern, we will be right maybe 60% of the time (and often far less), so that still leaves a significant percentage of the time that these patterns do not work as expected. All that matters is you understand the edge and what will happen over a very large sample of trades, and then make sure you are aligning your trades with the probabilities.
Lastly, these patterns are most useful if you own them and make them your own. I have trained traders in the past and one of the exercises I had them do was literally to find several hundred examples of support/resistance both holding and failing on daily charts, and then to examine price action on intraday charts around those levels. You really do have to see many hundreds of patterns before you are comfortable with all the variations of holding and failing (and then failures of failures). I do not believe it is constructive, or even possible, to catalog all of the possible variations, but intuition will slowly grow from repeated exposure. Be aware that there is a tremendous difference between understanding patterns and trading, and this is but one of many important elements of price action.

Daily Cocoa Futures
Let’s look at how this played out in the Cocoa futures market this past week. (Yes, I have deliberately picked a market that will be somewhat esoteric to many of my readers, but these concepts apply without loss of generality to any market and any timeframe.) Bigger picture (not visible on the small chart) shows cocoa has been in a downtrend after dropping below important support, consolidating lower and extending into another trend leg down. The last downtrend ended on the last day of August (the first blue-bodied candle on the chart below) with an outside bar that defined support and resistance for the next two weeks. We had several successful tests of resistance marked A on the chart below. (Note that this is a different type of test where the level was penetrated but held on the close of the bar. In many ways, this is a more meaningful test than a clean test.) I was expecting that support would break and the market would trade lower, but one day held cleanly to the tick (marked B), and the next dropped support (C). Let’s look at B and C in detail:

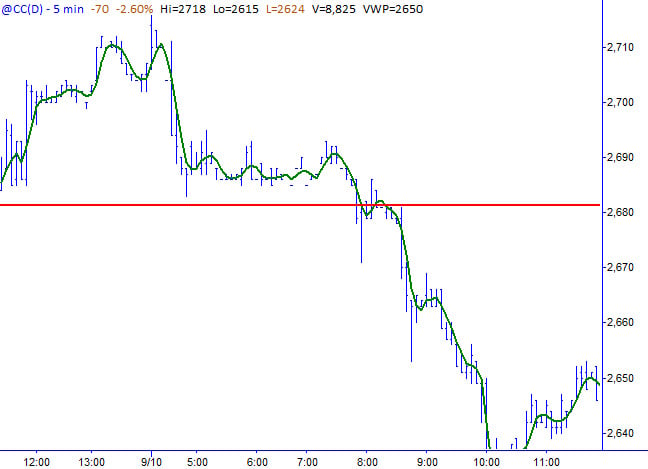
Price action at (B) – The level holds
Here we can see the price action on the day marked B on the daily chart, which shows clear price rejection at the level. I have added a very short-term moving average (a three-period moving average using (H+L+C)/3 as the price point for the average) as a tool to help outline the price action. I would not suggest using a short-term average like this in actual trading, but it is a good tool to help the eye see the overall trend of prices. In fact, it is useful to examine the action of a short-term average like this around many different support/resistance levels as a tool for learning. At any rate, we do see a textbook example of price rejection here as the level holds.
 At C, we see a completely different type of price action. First of all, we should have been on alert because price “should not” have been back at the level the next day if it was going to hold. A successful test with price rejection like we had the day before should have led to a series of higher lows as buyers held the market above the level. The next day, we are back at the level and now price goes dull and quiet at the level. We can see this in the price bars, but also in the moving average that consolidates near the level, then bleeds down through the level as the level fails.
Keep in mind that a successful test does not mean the market moves away from the level, never to return. Your trading strategy must have some rules for taking partial profits if you are going to make these kinds of trades because a move of a few bars away from the level is a reasonable expectation for a successful test. Buying support and selling resistance are, at best, low-probability trades, but being aware of this key element of price action can give the trader an edge in these very difficult trades.
12 Comments on “Interpreting Price Action: Unveiling Support and Resistance”
Adam,
Thank you for the awesome post! I really wish I knew this when I first started trading last year, it took me a good amount of time to figure out which has a higher probability of breaking through a support/resistance level through the exercise you mentioned of finding hundreds of examples. This exhaustive and fun exercise really improved my trading!
I am a bit confused when you wrote “buying support and selling resistances are, at best, low-probability trades” when you mentioned “most breakouts fail” in your Aug 28th blog titled “An Important Market Pattern”. Do you mind share some of your thoughts on this?
I am mostly a breakout trader that’s looking for increasing volatility out of consolidation/ important support & resistance levels, but have been trying to add buying support/selling resistance to my play book (trying to trade against my failed trades, which I documented my rules and examples in my private blog http://bit.ly/aJ8FmD and http://bit.ly/ctRtAG). I am also testing buying reversals off first test of important price level/ moving averages when the stock has a strong uptrend, price has a sharp move down to support and market pulling back to support level. I find that combining timing of the trading day, a/d of market, important price levels and most importantly “no news” on reversal plays have a decent 55-60% win rate and ~2.3x reward/risk ratio for an expected value of 1.34x off a sample of 87 real/paper trades I took in the past 2 months. I know this sample is very small and the win rate and expected value can certainly drop dramatically in a different market environment. Is there any exercise you would recommend that would help me speed up the learning/ analyzing process?
I have another question about stock selection on these support/resistance breakout trades. If a stock has a tendency to whip around breakout levels (fail breakout, then failure of failure and finally breakout after a few whips), is it better to avoid the stock since there are easier/ cleaner plays out there? For example, I find RAX has a big tendency to shake out traders around whole numbers breakouts. I identified that 21 was an important level on Thurs (9/9/2010). It broke 21 momentarily and failed hard in the morning, then it broke out during lunch and ran to R1 pivot before failing once again. RAX then proceeded to rest for rest of Thursday, then put in a strong session on Friday. It did a similar shake on 8/26 when it was trying to breakout of the 20 level. I believe it did similar shakes in breakouts on 12/2/09.
Thank you so much for sharing your thoughts! Your posts are invaluable and have helped me think about the details of my trades, and as a result improved my consistency and P&L. Thank you and have a great weekend!
Regards,
Chris
Really great post but as the gentleman before me wrote – the statement at the end about “Buying support and selling resistance being, at best, low-probability trade” is really confusing and I would not take that seriously.
@Chris: Let me think about your questions… I just got back in the city from being on vacation and brain is still not fully online. I plan to write a blog post soon on expectancy / “gambler’s math” so it may make sense to work some of your questions into that. let me see.
@Ivan: S/R trades look great on charts and look so easy in retrospect, but it’s very difficult to judge your true risk or reasonable reward in most cases. There are of course many different kinds of S/R levels, and working off of levels in trends is very different than trading a market bouncing around in consolidation… so you just have to be clear what kinds of trades you want to do. If you have consistent P&L from a large number of trades, then yes maybe you’re onto something… but I’ve seen too many guys over the years thinking that buying at the bottom of a range and selling at the top is the easy to to make a lot of money… and I’ve never seen it work like that. I have basically eliminated the “range play” from my playbook, though I will buy a move off of support in a few specific cases. This may well be mostly an element of personal style though.
Glad you both enjoyed the post. Though provoking questions.
Thanks for the reply Adam,
What I mean by “Buying support and selling resistance” is not the “range play” – it’s just that there are certain levels on many charts that are so strong that you know that about may be 70-80% of the time the price will bounce at least a little bit from them. So if you fade against those levels you can move your stop to breakeven after this small bounce.
Of course it’s not always that simple and I admit that this strategy is not necessarily consistently profitable for me on the stock market but is definitely being very rewarding on FOREX for many months now. Just look at the GBP/CHF pair and how many times the price bounced very strongly from1.6300 and 1.5830 levels the last few months – unbelievable. Those were my best trades ever.
Take care.
On the second graph the initial decline does not have much of a pullback, indicating, as consistent with Adam’s earlier post, that the commodity has bearish probabilities. Where I do see a good opportunity for a trade based on support levels is at around 8:15 at 2,705. After witnessing support here twice in a row, the third bounce gives a solid technical signal, an opportunity better yet with increased volume and higher prices on the bid and offer.
I see brief support around 2,695 and later a return roughly to the earlier range between 2,705 and 2710, which also offered probable support/resistance opportunities, not without respect for the hindsight rule.
Aside from that, support/resistance trading was certainly difficult in this commodity because at least 70% of the price movement, and particularly the turnarounds, had no recent technical precedent or discernible range pattern. In this data I don’t necessarily find evidence against support/resistance trading – but I do find that those kinds of trades are almost impossible to make well without clear support/resistance levels.
Traders who rely more heavily on levels would probably have done well to seek out stocks which adhere to them more dependably. With other methods to trade this more esoteric price action though (news, tape, solid downward momentum) I can definitely see the potential.
Adam,
Instead of specific prices can we think of support/resistance in terms of price zones?
Eric:
Yes. Absolutely. The times when a support/resistance level is actually one specific price are far outnumbered by the times the level is a rough and messy zone.
Adam, In light of talking about the lowest probability trades, how about a future post on easy trades.
I’ve always thought about this idea. If in basketball the single easiest score is a layup, what layups should we be taking all the time in trading? I ask this because everyday I find myself taking a whole bunch of jumpshots, three-pointers and slam dunks but layups are the most consistent thing in the sport. Thx.
Very useful !!!
Great article – just wondering why support / resistance is suppose to be the corner stone of any trading plan, yet you say ‘Buying support and selling resistance are, at best, low-probability trades’ – do you mean just blindly doing this or in any form?
Thanks
i meant doing it blindly… price action around the level adds a lot of confidence to the trade.
Thanks for the clarification – great articles on this site.