This post is another in a series that we will be publishing over the next month , tracking the hypothetical performance of broken wing butterfly trades selected by Greg Loehr of Optionsbuzz.com.
If you were following along last week with the hypothetical AAPL 610-605-595 put broken wing butterfly, then you saw how that example returned a profit of 31% (calculated on the max risk of the trade) as of 2:30pm ET last Friday just before the options were set to expire. Why 2:30? Because I had to pick up my eight-year-old daughter from school.
But as I noted in my blog previous to that time, if one has the necessarily technical skills to read a stock’s movement intra-day, then using those skills can help one to perhaps better time the exit of a butterfly. Here’s the risk graph as of 2:30pm.
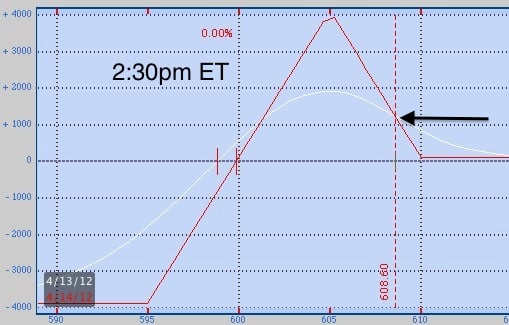
Broken wing with $1.55 (31%) hypothetical profit
And with less than two hours to go before expiration, if this had been a real trade, here’s where the position could have potentially been squeezed to the proverbial gills. Notice the white line. That’s an approximation of the profit or loss of the trade. If the stock goes up, this trade can lose the $1.50 profit. But with the stock above $610 the options would go out worthless and the profit would still be the 5-cent entry credit. So if one thought the stock might continue above $610, then one could simply close the trade.
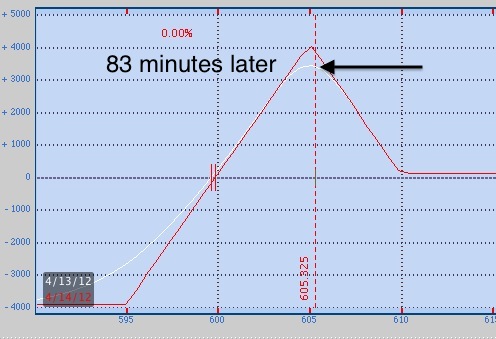
But notice what can happen if the stock goes down. If the stock starts to move down toward $605, then before the trade gets to the point where it loses, it has to generate a bigger profit first. And this is where one’s tape reading skills might help to better determine when to close the butterfly before the end of the day. Here’s why: only 83 minutes later this butterfly example went from trading for a $1.50 credit to more than a $4.50 credit as the stock sold off in the last hour.

Broken wing with $4.55 (92%) hypothetical profit
Of course, had this been a real trade the final profit or loss would be determined at the time of exit. But I think this example aptly points out one of the broken wing butterfly strategy’s most powerful attributes, which is (depending on timing and stock price) the scenario of having to go through an area of profit on the risk graph before getting to the area of loss.
I’ll be back tomorrow to update the hypothetical trade I’m tracking on the SPX from last week.
Trade safe!
Greg Loehr
Optionsbuzz.com
Please note: Hypothetical computer simulated performance results are believed to be accurately presented. However, they are not guaranteed as to accuracy or completeness and are subject to change without any notice. Hypothetical or simulated performance results have certain inherent limitations. Unlike an actual performance record, simulated results do not represent actual trading. Since, also, the trades have not actually been executed; the results may have been under or over compensated for the impact, if any, of certain market factors such as liquidity, slippage and commisions. Simulated trading programs in general are also subject to the fact that they are designed with the benefit of hindsight. No representation is being made that any portfolio will, or is likely to achieve profits or losses similar to those shown. All investments and trades carry risks.
No relevant positions.