Traders,
Just a fantastic opportunity on Friday, one which we spoke about ahead of time in IA, where I briefly mentioned names like ORCL and NBIS. Why those names in particular, along with several others? RSI had stepped into deep oversold territory, and prior leaders began to capitulate to the downside, without any relief bounces, making them prime for a relief bounce. Especially so if the market were to gap down, as we saw on Friday. Just an excellent V recovery on Friday, and one certainly worth studying in further detail.
For the week ahead, I remain open-minded. I’m not coming into the week as a bear or bull. I’ll be using levels from Friday to navigate the action early on in the week. Of course, I cannot run through every name and scenario I am watching. So, I’ll outline my overall thoughts on SPY, a potential short setup in SNDK, and a few continuation long setups in +beta names.
Here are some names of interest:
The Overall Market: SPY found support near the prior week’s Friday action. Going forward, Friday’s low has now become the all-important level to watch for trend break and possible continuation to the downside. Conversely, if we reclaim Friday’s high and the converging 10- and 20-day SMAs, we might enter a period of consolidation and chop before a directional move.
So, the two zones of interest for me going forward will be $660ish support in SPY and $675-$680 resistance. If either level flips, the sentiment and trend could shift rapidly.
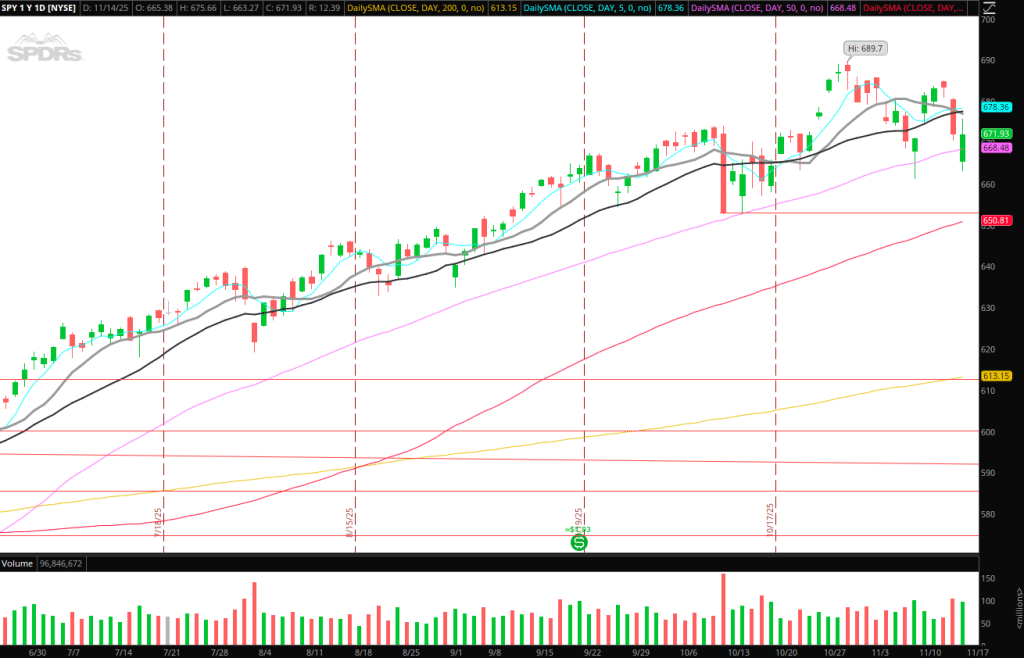
*Please note that the prices and other statistics on this page are hypothetical, and do not reflect the impact, if any, of certain market factors such as liquidity, slippage and commissions.
SNDK: Awesome short opp on Thursday, followed by relative strength on Friday. The 10-day SMA has held support for 2 days in a row, so that remains key support to watch for a bigger-picture momentum shift setup. Similarly. $265 – $270 remains significant resistance and will continue to be an area I watch closely for a failed follow-through, potentially setting up a short. Additionally, I’d need to see relative weakness against the overall market, which would signal a major character shift. If the range tightens and this builds within the prior 2-day range, I’ll be hands off and wait for a directional breakout.
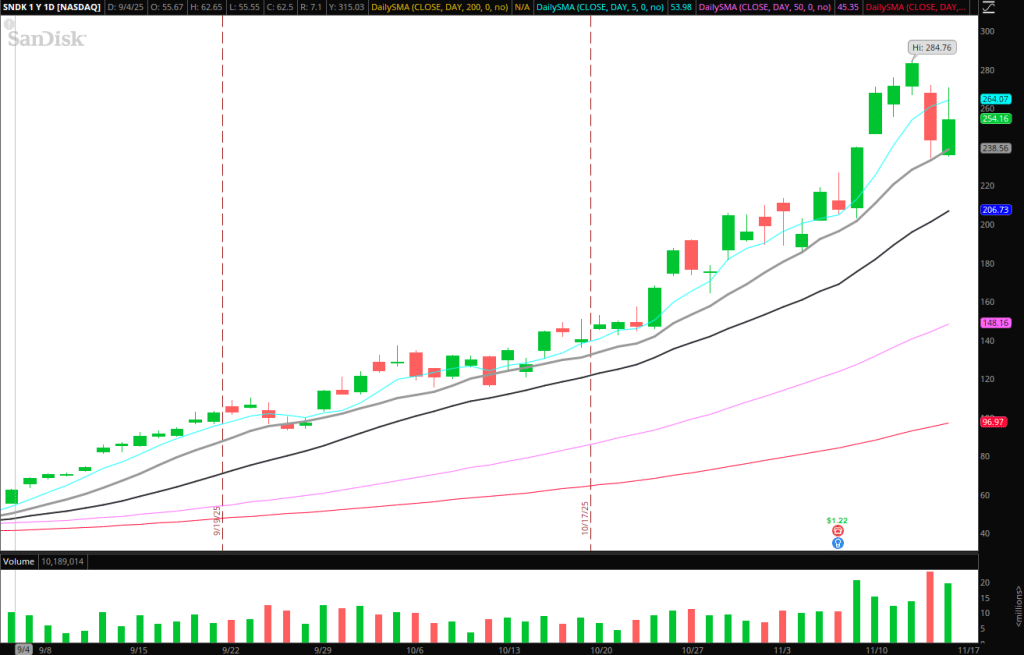
*Please note that the prices and other statistics on this page are hypothetical, and do not reflect the impact, if any, of certain market factors such as liquidity, slippage and commissions.
ETHA / IBIT: Great relative weakness on Friday. In an ideal world, we get a gap down / flush lower, followed by capitulation, to set up an A+ bounce opportunity. If we grind lower, that downgrades the setup immensely. Alternatively, suppose IBIT/ETHA breaks its relative weakness trend against the market and holds above the 2-day VWAP / VWAP from Friday. In that case, I’d look for continuation to the upside with an intraday trail. However, as I’ve said before, the only long as it relates to IBIT and ETHA that I’d risk-on would be capitulation to the downside.
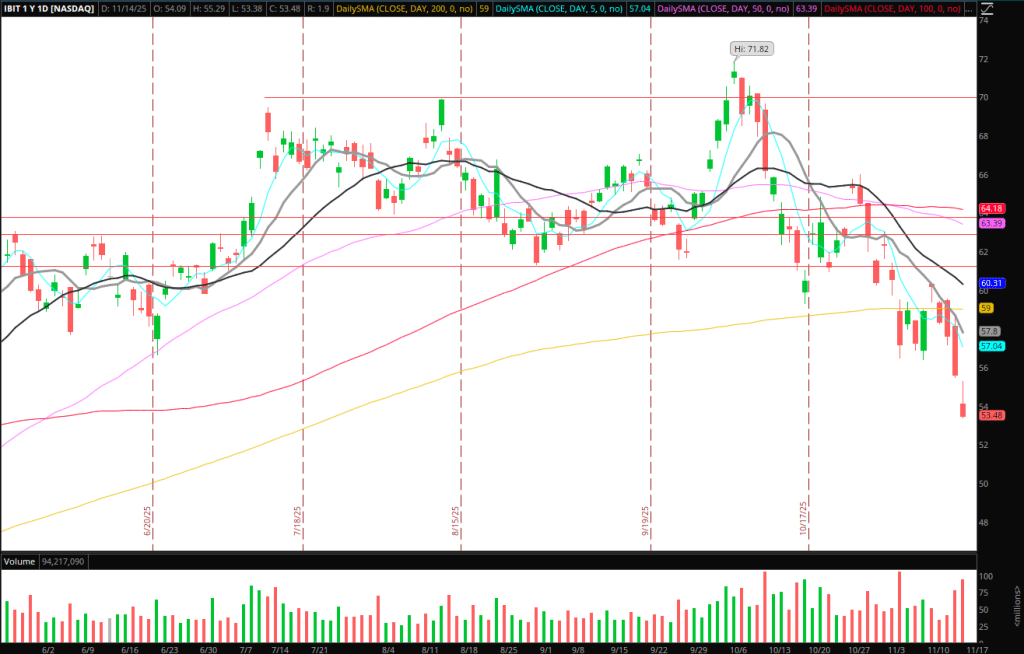
*Please note that the prices and other statistics on this page are hypothetical, and do not reflect the impact, if any, of certain market factors such as liquidity, slippage and commissions.
Now, if the market builds above Friday’s low and we get a higher low confirmed, where would I look for upside continuation beyond SPY/QQQ?
TSLA: Tesla found resistance on Friday at prior higher timeframe support. For intraday momentum, I’d look to get long through Friday’s high and HTF resistance, with a 5-minute higher low trail.
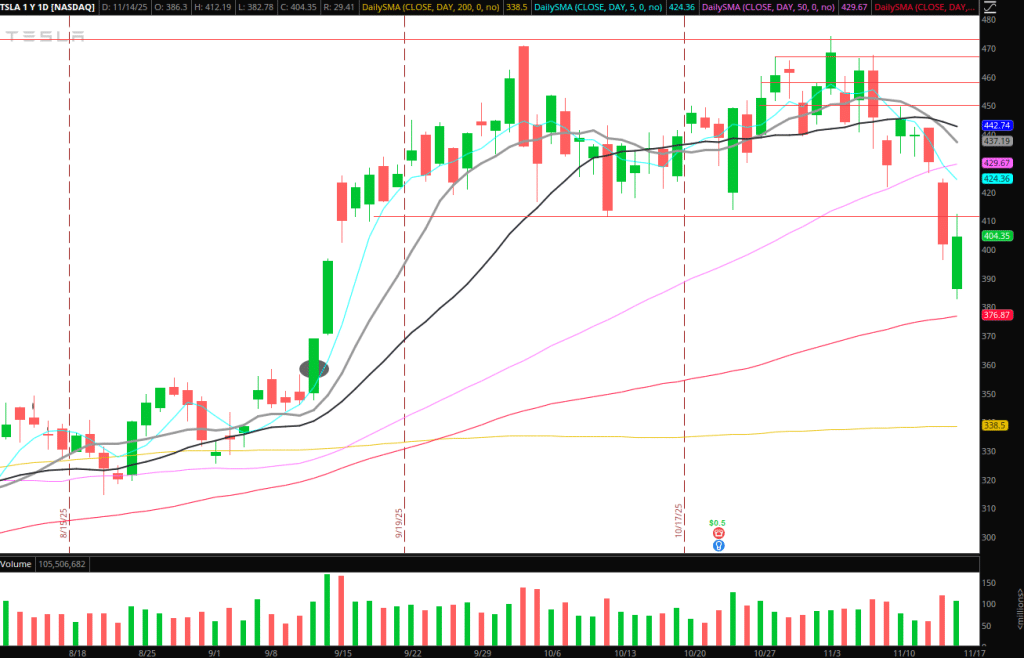
*Please note that the prices and other statistics on this page are hypothetical, and do not reflect the impact, if any, of certain market factors such as liquidity, slippage and commissions.
ORCL: For upside continuation, I’d need to see ORCL hold above $222s and confirm a higher-low. Thereafter, I’d need to see a break above Friday’s high and consolidation resistance. That would also be the 5-day SMA, and could indicate the start of a multi-day bounce.
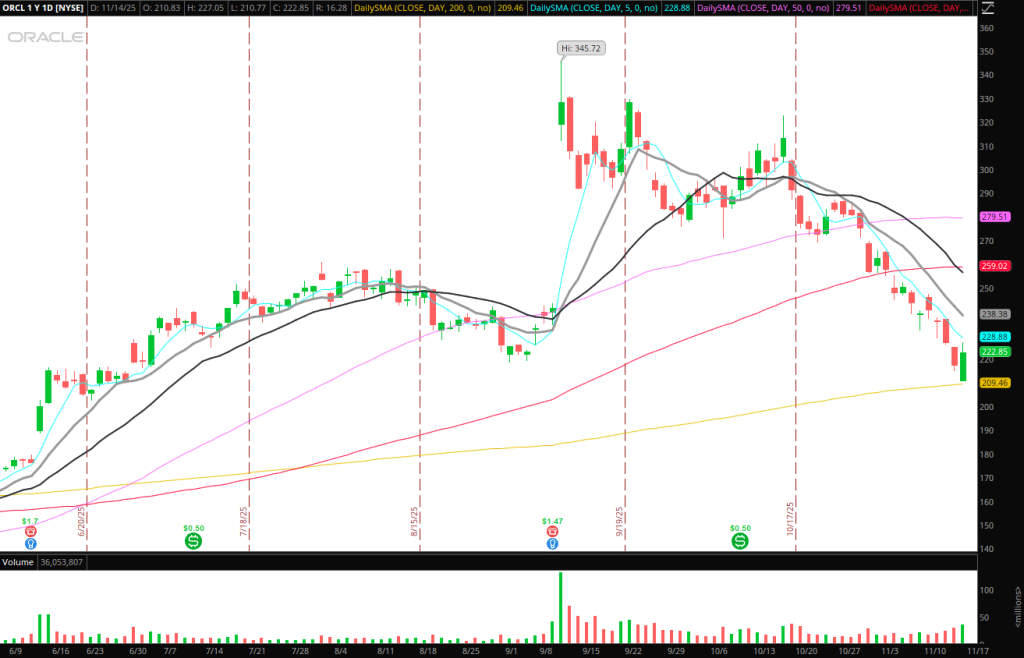
*Please note that the prices and other statistics on this page are hypothetical, and do not reflect the impact, if any, of certain market factors such as liquidity, slippage and commissions.
NBIS: Turned relatively weak in the second half of Friday. However, if this takes out Friday’s high, that would be the first prior-day high break since it rolled over and extended to the 100-day SMA. That break might signal a long entry for me if the stock is displaying relative strength on the day.
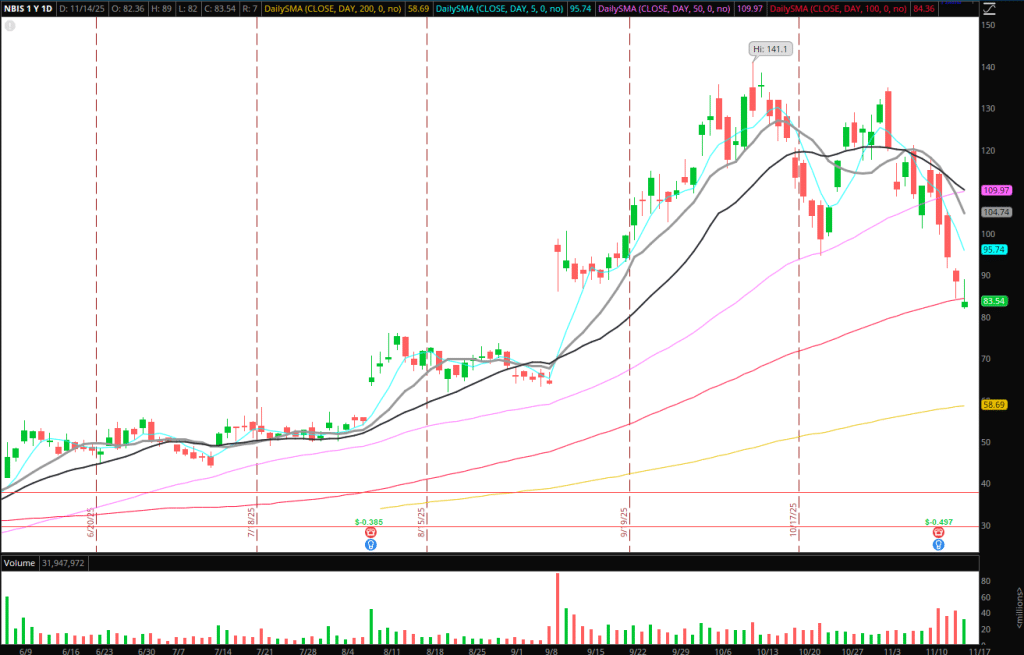
*Please note that the prices and other statistics on this page are hypothetical, and do not reflect the impact, if any, of certain market factors such as liquidity, slippage and commissions.
CYPH: Perpetual squeezer and solid liquidity trap that played out on Friday. $3.4 is now the central zone of resistance and a failed follow-through potential area to watch. If we push into that zone and trade above/below and fail on re-tests, I’d look to join the trend lower against the most recent lower high. Alternatively, if this traps and reclaims $3.4 +, I’d be hands off and wait for a blowout to the upside before considering a short.
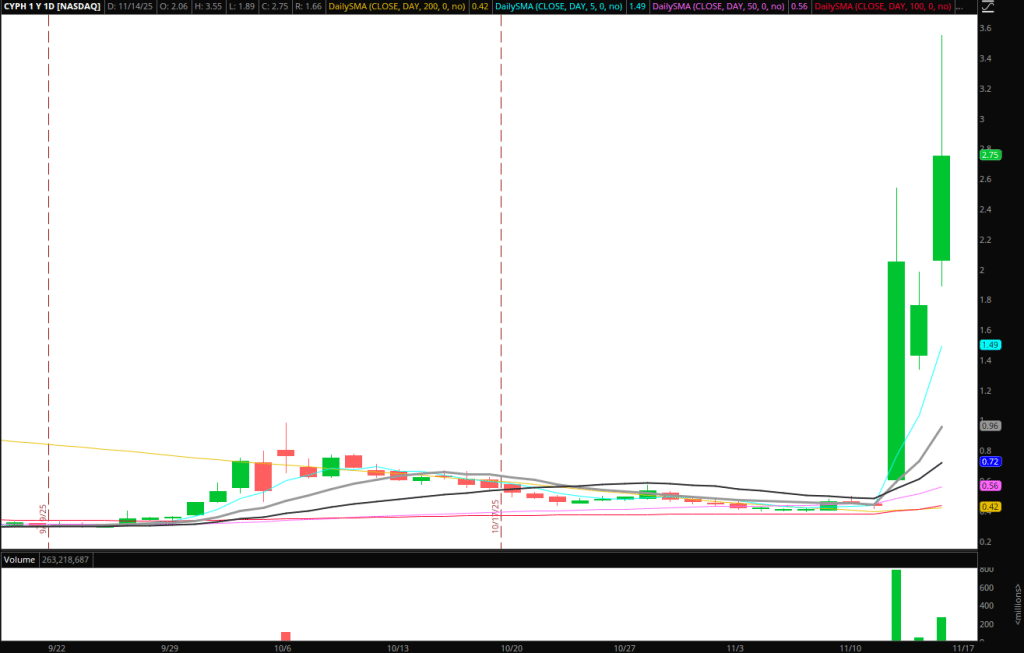
*Please note that the prices and other statistics on this page are hypothetical, and do not reflect the impact, if any, of certain market factors such as liquidity, slippage and commissions.