
Traders, let’s not waste any time. Let me tell you why my ultimate swing trading guide might help you in your efforts to reach the elusive status of consistent profitability trader.
The simple answer is the source: I’m a senior professional trader at SMB Capital, one of the world’s most successful proprietary trading firms. Everything we do here is rigorously put to the test day in and day out by some of the world’s top traders. So, you can be sure that what I share with you is tried and tested.
And in this course, I will be guiding you step-by-step, teaching you exactly what swing trading is, how to precisely identify the best swing trading opportunities, how to manage those positions like the pros do, and how to limit risk like an elite trader. I’ll also teach you the ins and outs of my three favorite swing trading setups.
So, by the end of it, you’ll have a solid foundation and be equipped with actionable insights and techniques to hit the ground running. Let’s jump into it.
Right before we get into the juicy stuff, here’s a little bit about the specific style of swing trading I’m going to be teaching you, as well as a bit about myself.
Discretionary trader. I am a process-driven, systematic trader. However, at the end of the day, I am a discretionary trader because I make subjective decisions about when to enter and exit, and I rely heavily on my own technical analysis to make informed decisions. While I use technology to complement and improve my trading, my strategies are not automated.
Multiple Timeframes. I trade across multiple time frames and will show you exactly what I mean later in the post. I am active intraday, with several intraday strategies, and across multiple days, with my swing trading playbook.
Open-minded and unbiased. I like going long and short and trading small caps, low floats, large caps, and indexes / ETFs. While I like to form a bias about a stock direction, once I have confirmation, my mission as a trader is to react to the price action once my plan is confirmed and ensure that I have a positive expectancy and favorable risk: reward.
Diverse Set of Swing Strategies. I have several top swing strategies: Consolidation Breakouts/breakdowns, Mean Reversion short, Lower high short swing/ dead cat bounce. I’ll go over an example for each strategy later in the presentation.
Before we get into exciting stuff and I reveal my top swing trading strategies, let’s cover the basics, starting at the very beginning: What is Swing Trading?
Swing trading, as I view it, is a unique blend of fundamental analysis, price action trading, and technical analysis. It involves holding positions for a minimum of a full day and up to a month.
Traders aim to capture a directional move, either long or short, by using technical analysis and price confirmation to enter, hold for days or weeks, and then exit, hopefully for a gain.
This style sits just above day trading regarding its expected hold time.
Successful swing trading heavily depends on correct stock selection and technical analysis, relying on price channels, volume, and several key indicators for informed decision-making.
Becoming a pro at swing trading is all about nailing that balance between understanding the market, picking the right stocks, effectively managing your risk and achieving a skewed/positive risk: reward, and having precise entries and exits.
So, now that you know what swing trading is, who is best suited for swing trading, and what makes a good swing trader?
What’s your individual preference? – The suitability of being a swing trader depends on individual preferences, like your risk tolerance, time commitment, and trading style.
Some traders prefer the more active involvement and quicker trades of day trading, like scalping or momentum trading, while others might find the more extended holding periods more suitable. There’s no right or wrong, and no strategy is superior. It’s just preference.
So swing trading can appeal to those who want a balance between active trading without needing to monitor the markets constantly or watch price action tick for tick.
Technical analysis: Swing trading heavily relies on technical analysis. For those of you that are beginners? What is technical analysis? – Simply put, TA is an analysis method for examining, understanding, and predicting price movements using charts, indicators, and market statistics.
Specifically, using key indicators, identifying chart patterns and support and resistance, and identifying potential entry and exit points.
My favorite indicators are VWAP and the Simple Moving Average. VWAP shows me the average price based on price and volume. It’s my most important indicator, and I use it mostly intraday to gauge sentiment, trends, and entries and exits. I use the SMAs on my daily charts, and they represent a stock’s average closing price over a specified period. I find immense value in them as a trend indicator.
Don’t worry. I’ll show you how I set my charts up in the next section!
This style of trading primarily works well during trending markets and periods of volatility: Swing trading works well when markets exhibit clear trends, whether upward (bullish) or downward (bearish). Traders can then capitalize on these directional movements. Volatility in the market can provide opportunities for swing traders. Extreme price fluctuations can result in excellent mean reversion swing opportunities in both directions.
I keep it simple regarding my chart setup and inputs. Why? I purposefully use the indicators that add the most value to my trading system and make the most sense to me without complicating my system.
If I consult too many indicators or add too many inputs onto my screens, it will have the opposite effect that one might think. I found early on that doing so would cause too much hesitation in my trading and would not add value for me.
So, what do I look at most across my screens?
I look at Volume and Price. Specifically, I look at the VWAP intraday and across multiple days if the stock is in play over multiple days. And on the daily chart, I look at simple moving averages.
Regardless of my personal view on them, because they are so popular because everyone is looking at them, there is real weight behind consulting them and having them on my charts.
Now, what timeframes am I using? I will always have at least three timeframes for any stock I watch. The daily chart, hourly chart, and usually the 5-min.
Depending on the strategy, my ideas mainly stem from the daily chart. The daily chart, with the 5 – 20 – 50 – 200-day SMA overlayed, is the starting point when analyzing a specific stock or sector and determining whether or not a potential swing opportunity exists.
From there, I want multiple timeframes to align.
The next step for me is to consult the hourly chart to determine if there are any critical levels of support or resistance that I cannot as quickly identify on the daily chart, along with identifying recent pivot spots, higher lows, or lower highs.
Then, the lower timeframes when I am actively watching the stock trade and stalking for an entry intraday, although mainly during the morning before the higher timeframes have set up. Once the morning trading has settled, around 10.30 am – 11 am, I will primarily be focused on a 5-minute and hourly- chart and not look at anything under 5 minutes.
So, for example, let’s do a brief walkthrough of using multiple timeframes, from daily down to 5-min.
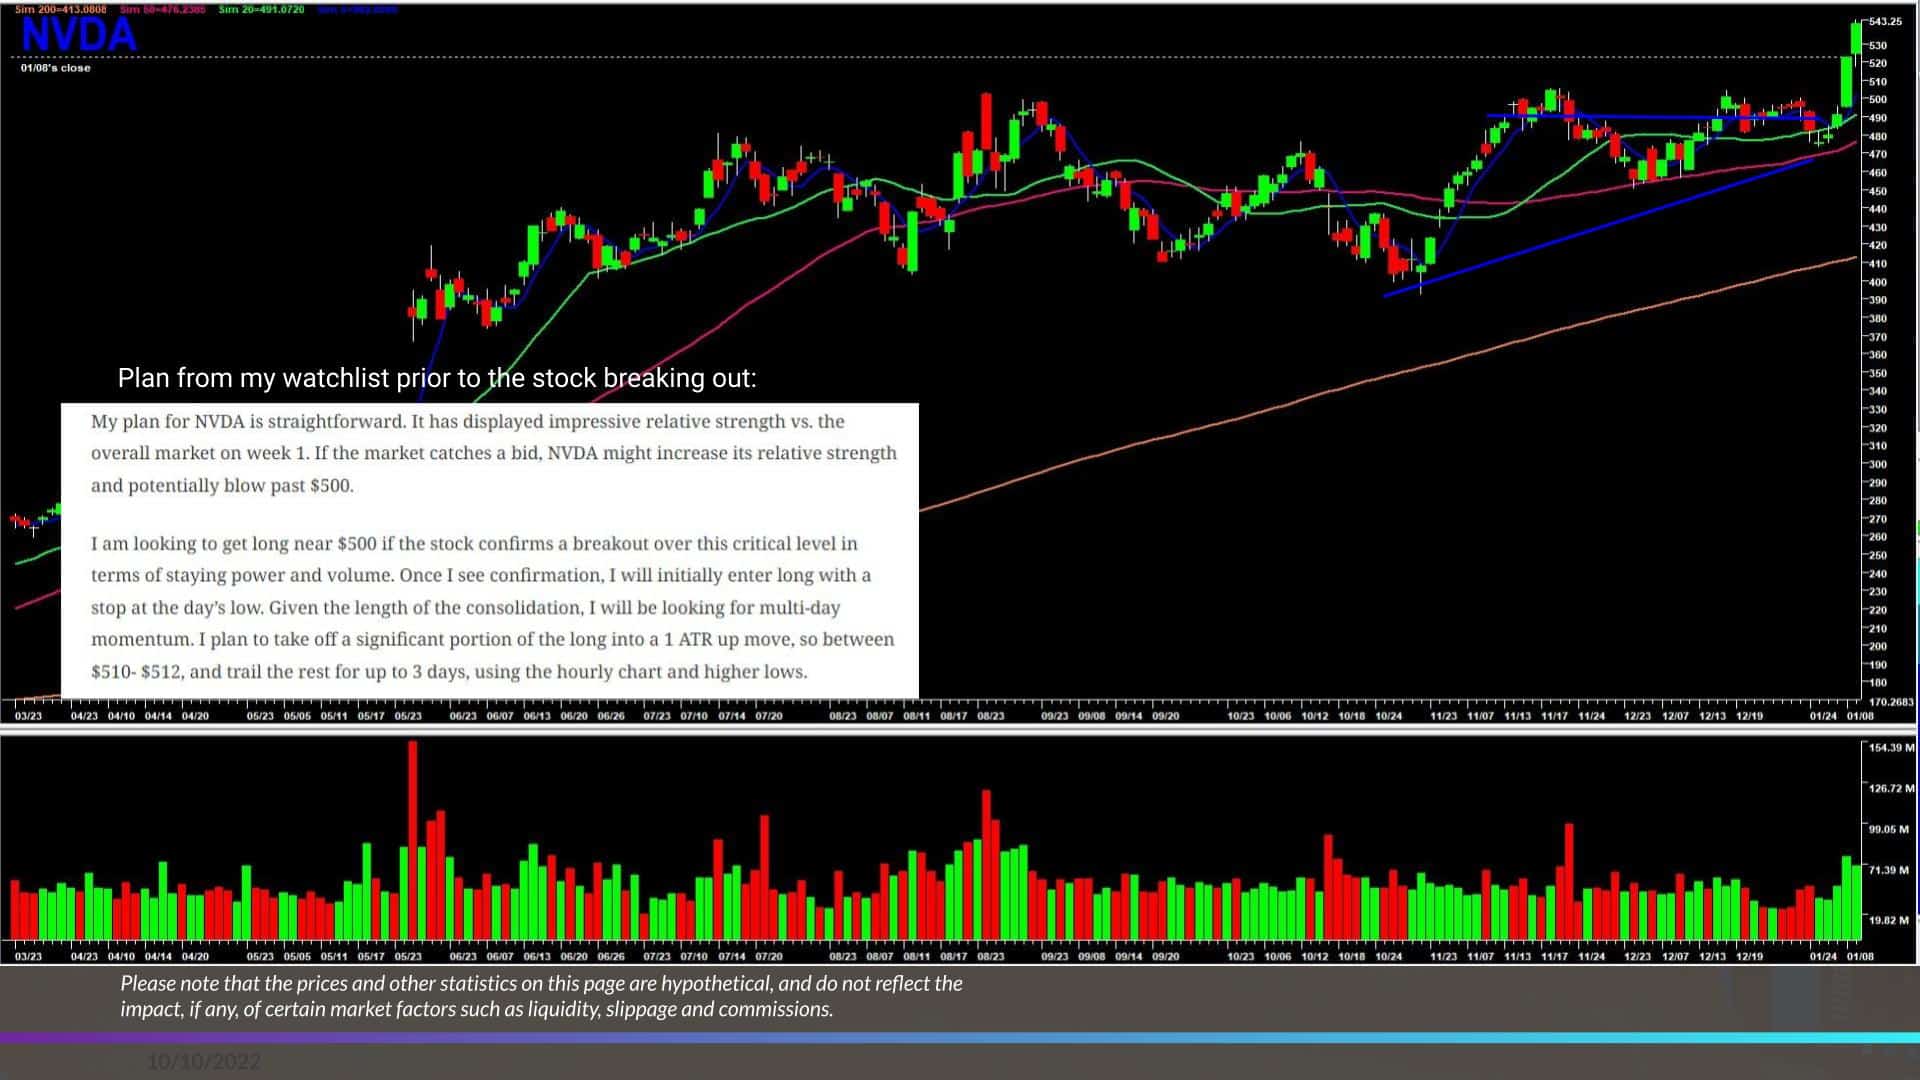
Starting with the daily chart for NVDA, an actual trade plan, and an idea I shared in my watchlist.
- Remember: I use multiple timeframes to paint an overall picture of the idea and key indicators to complement the idea and facilitate my decision-making.
- On the daily, as I pointed out in real-time when I first shared the idea before the breakout, I loved the multi-month consolidation above key-MA’s, coiled near a significant breakout resistance level of $500. So the idea comes from the daily. Now, to my next chart, the hourly.
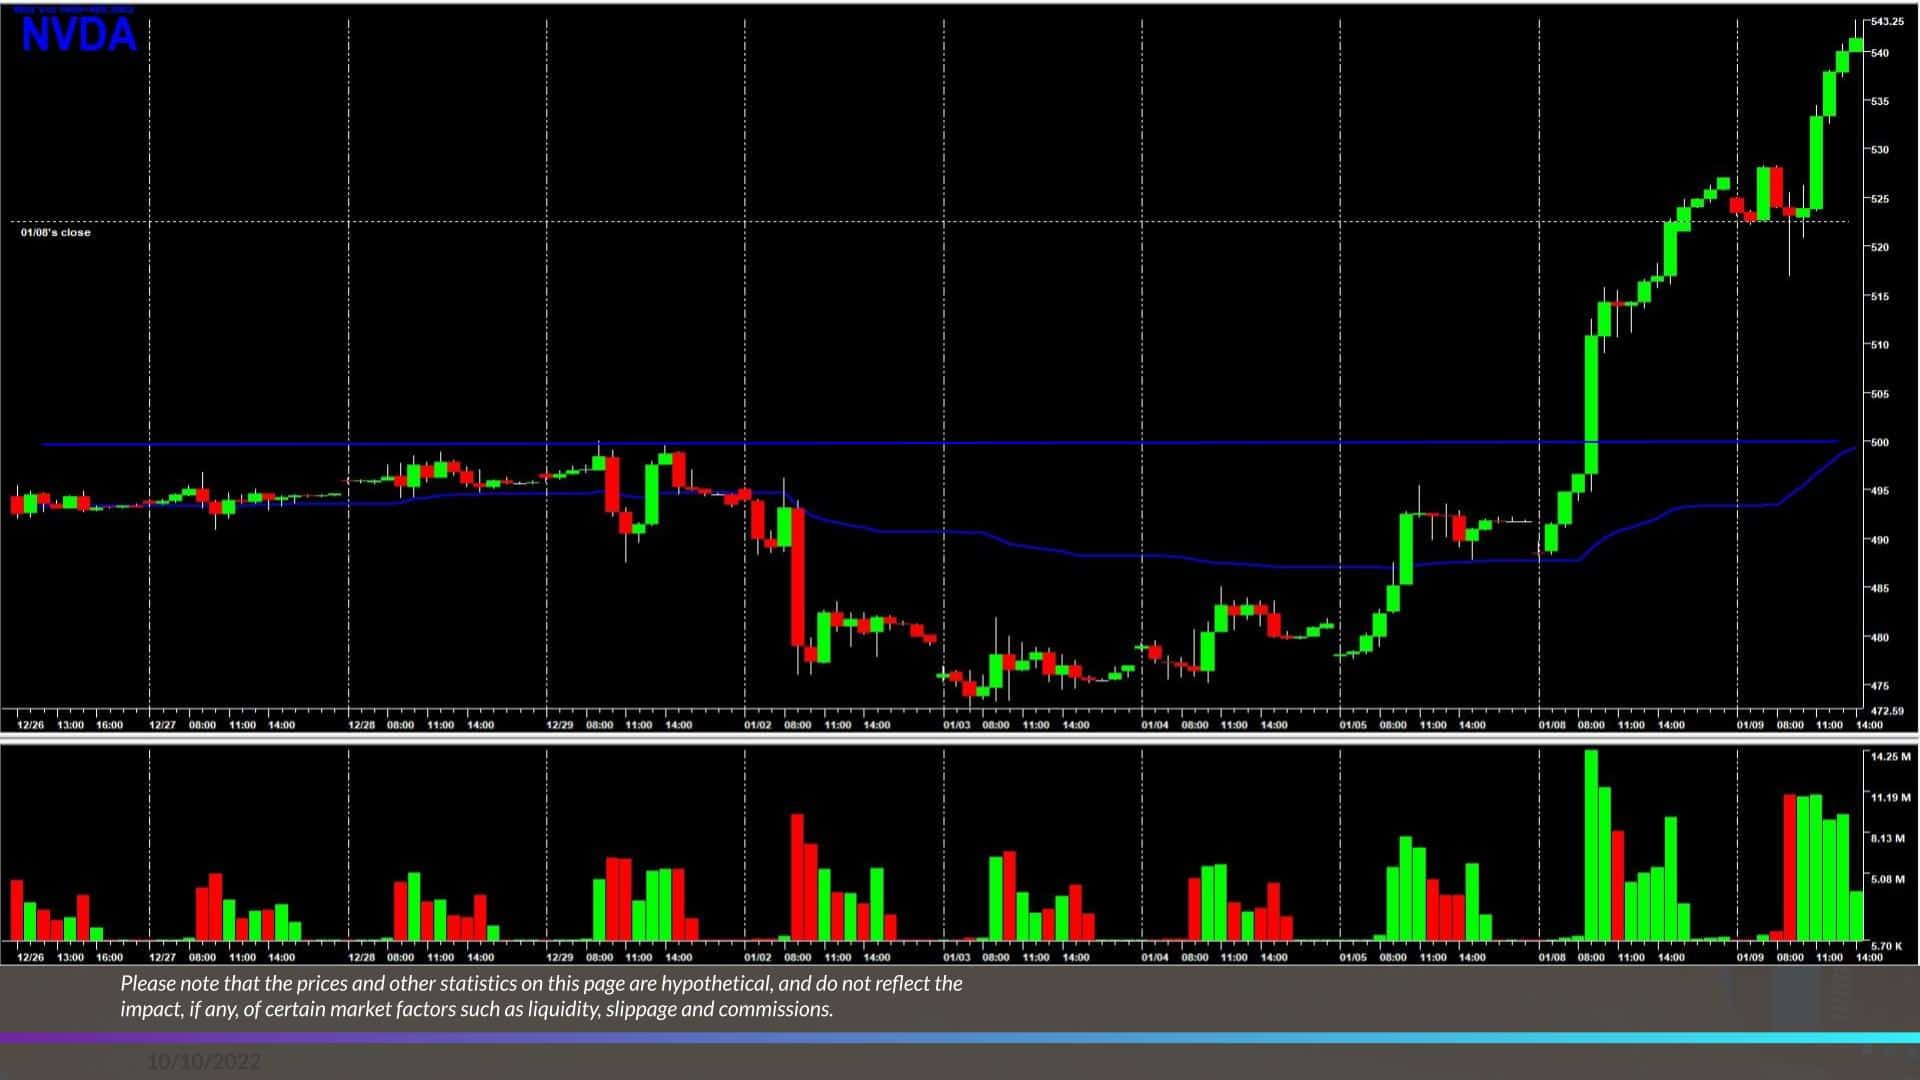
- Does that level shine through and remain relevant on a lower timeframe compared to the daily, such as this hourly chart? Yes, it does.
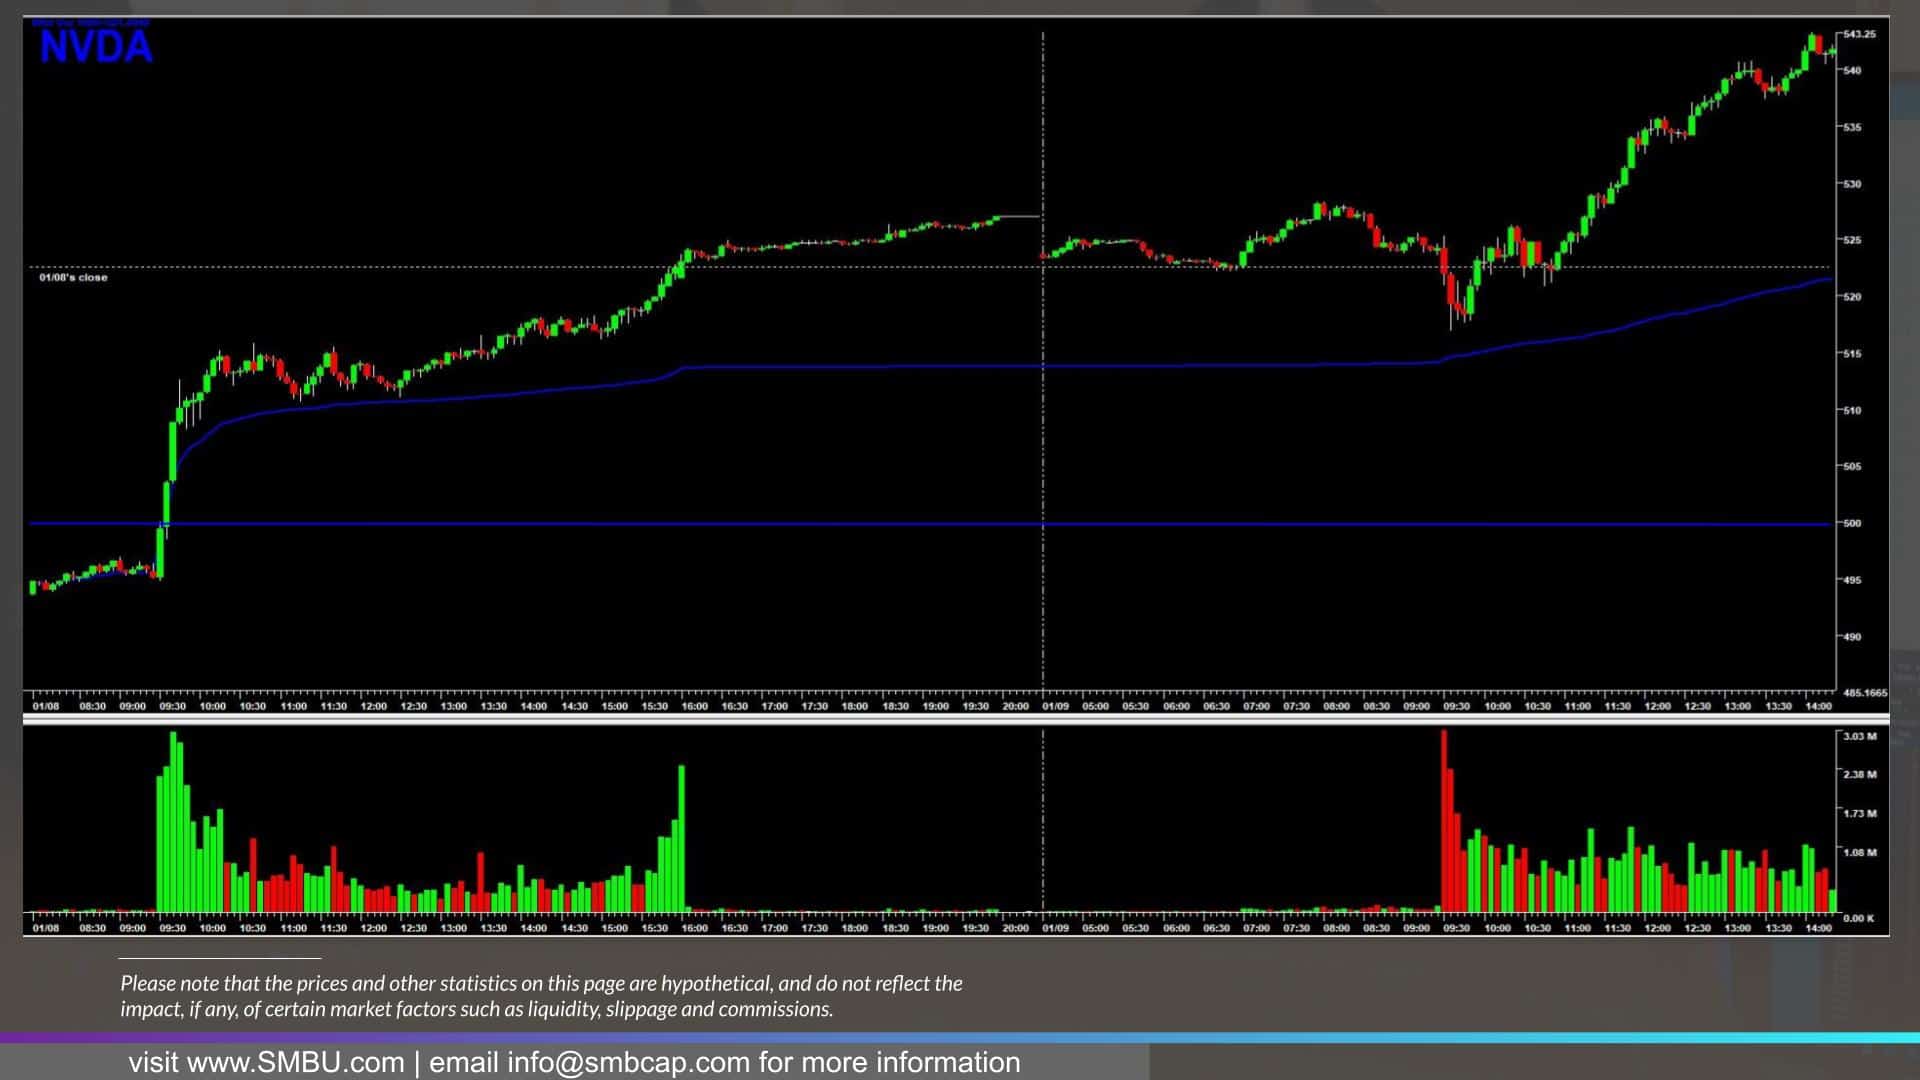
- Now, onto the 5-minute chart, a lower timeframe and one that I will use for precise entries. Specifically, I am looking for the stock to have sustained buying over the key level and to hold above. If one is not focusing on reading the tape, a helpful tip is to look out for sustained abnormal volume and for the price to remain above the breakout level and intraday VWAP, which would signal strong price action and confirmation of buyers stepping above the breakout level.
- Once I have entered the position, using a lower time frame for precise entries, like the 5-minute, I will have my hard stop in place, and as the trade develops, I will switch to a higher time frame to manage my position and keep tabs on it.
- The key here is that all timeframes should be aligned and work together.
Now, just before I reveal my favorite swing trading strategies, let’s go over the key variables and nuances that make up a good swing trade opportunity.
Now that you understand what swing trading is and the timeframes that I like to consult, along with the indicators, let’s go over what boxes need to be ticked to qualify a potential swing opportunity.
And then, after this, I’ll go over some of my favorite swing setups and specific strategies.
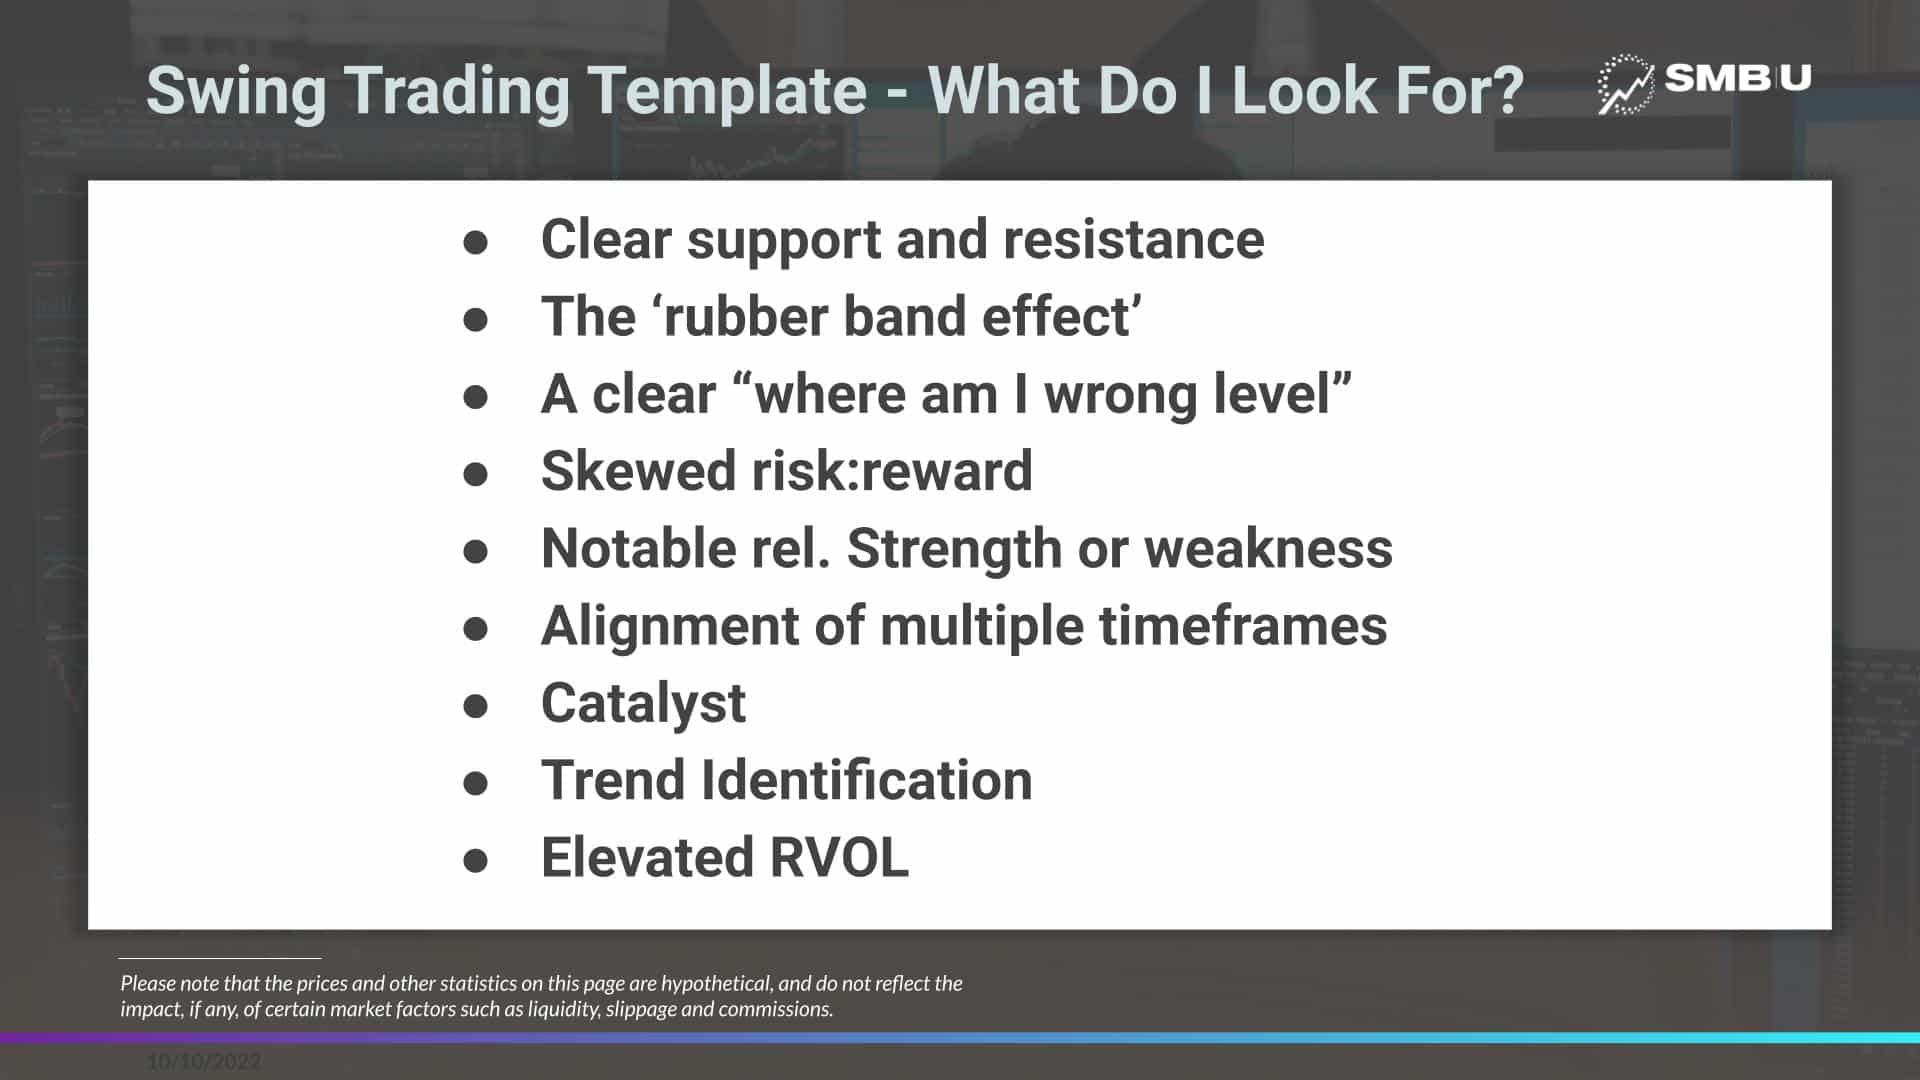
Established level of support and resistance. I need to identify clear levels of support and resistance, which, if breached, could signal and confirm a significant breakout that might lead to substantial directional moves. What is a clear level of support or resistance? It’s a price area because it’s not always an exact price that has been tested over multiple days, weeks, or even months and continues to hold as support or resistance, making it a substantial area of interest and possible inflection point.
The Rubber Band Effect – contraction in price and volume, anticipating the expansion. Think of a rubber band – the harder you pull, the greater it contracts, and both bands converge until it finally snaps. For a consolidation breakout, the longer the consolidation and contraction, the greater the momentum might be once the price finally breaks through either support or resistance.
A clear level to risk against + the potential for a skewed risk-reward
Displaying notable relative strength or weakness. For example, this might be a relative strength or weakness to its sector or the overall market.
Alignment of multiple timeframes. As I went over in Nvidia, I would like for numerous timeframes to align, beginning with the higher timeframe. I get excited if the timeframes align and key levels hold weight across them all.
A catalyst – catalyst might be breaking news i.,e. fundamental or even technical, in terms of a significant shift in momentum or breakout.
Trend Identification – the key SMAs align with the anticipated breakout trend. For a mean reversion, i.e., a medium to small cap that has gone parabolic over several days or weeks, I look for price to extend from key MAs significantly.
Elevated RVOL – First, what is RVOL? It’s an indicator that tells traders how the current trading volume in a stock matches up to previous trading volume over a given period.
I look for heightened RVOL, at a minimum of 1.5, above the breakout level. Although many stocks break out / break down without elevated volume / RVOL, I prefer to avoid participating in such plays. Elevated RVOL on stocks breaking out not only increases liquidity, which allows me to manage risk better but also signals that the breakout might experience greater momentum due to the increased flow and participation.
Skewed R: R – I look for setups that, if confirmed by price action, hold the potential to offer an outsized reward. For that to be the case, I need the above to be present but ALSO realistic targets in mind. Targets that, if met, will result in at least a 3:1 return.
Now, let’s look at all of these factors on a chart.
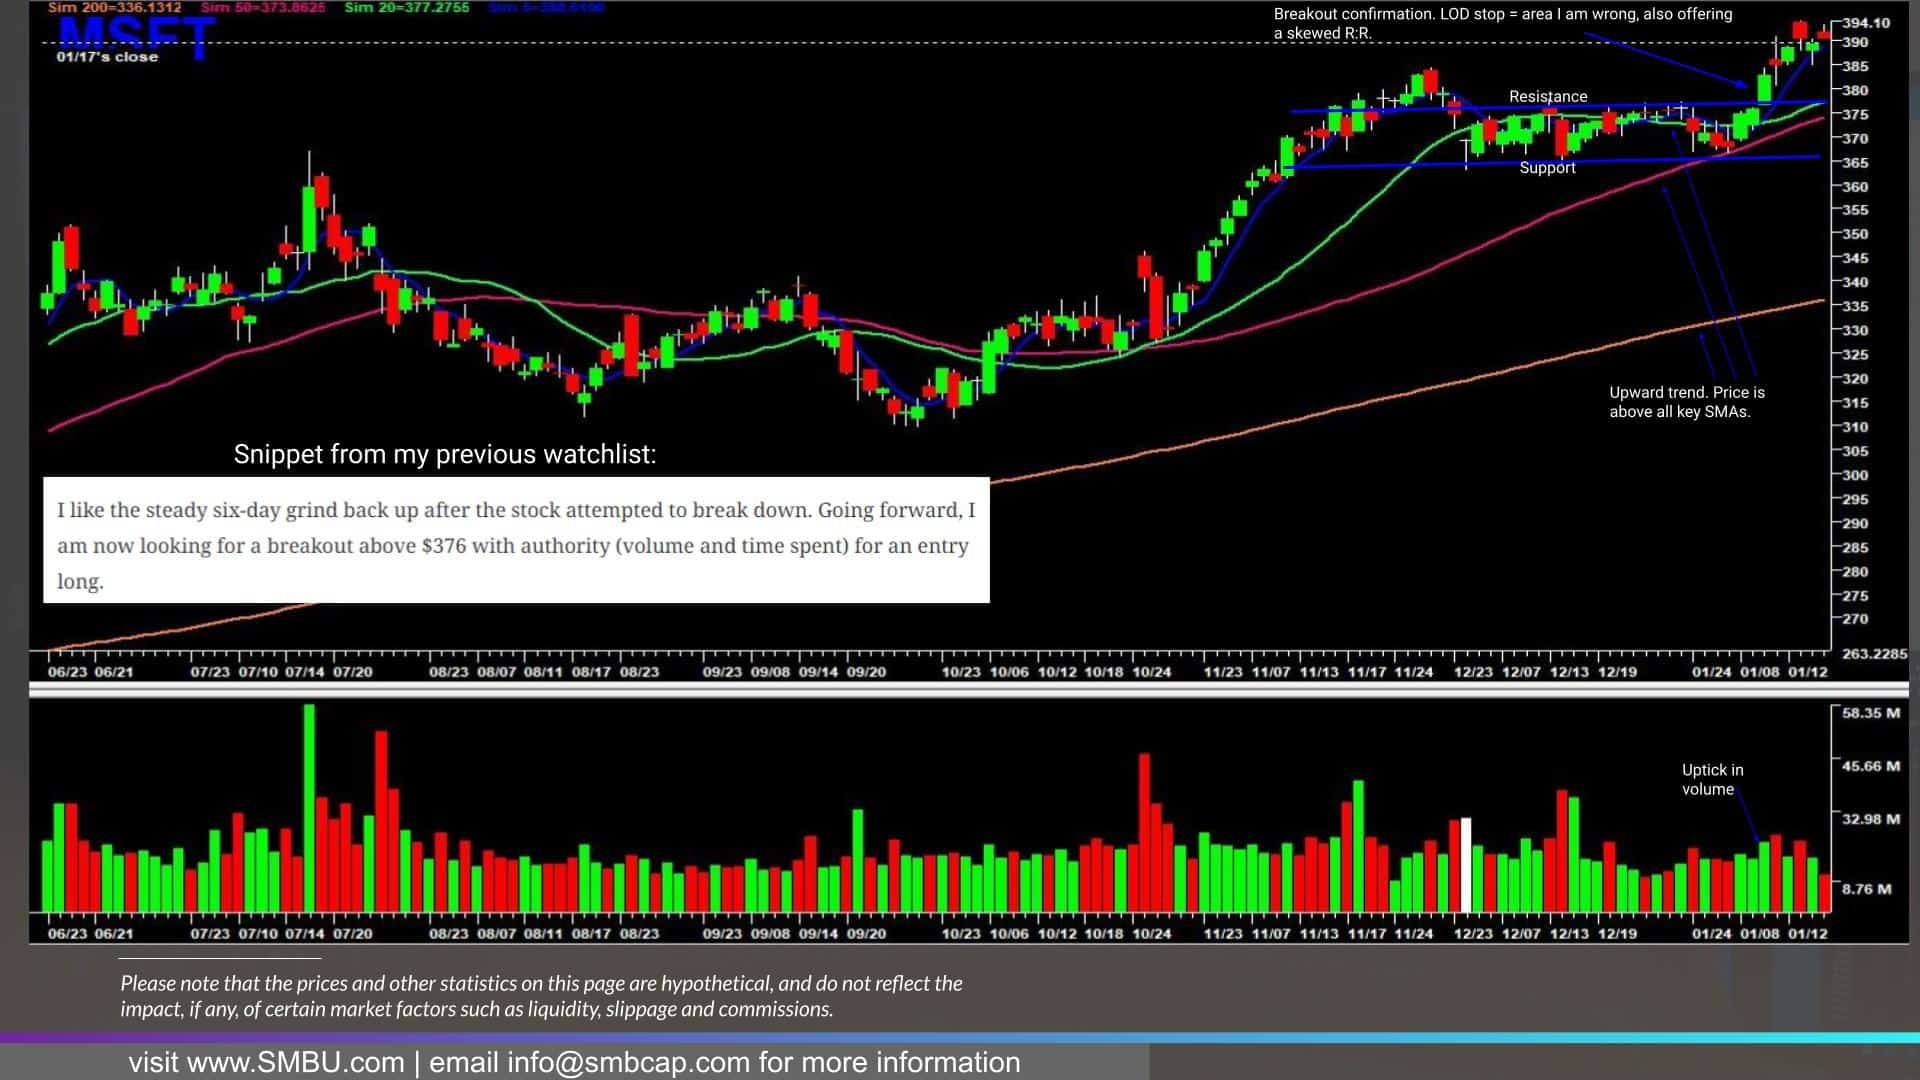
So, let’s look at Microsoft on the daily chart and become familiar with the factors I just outlined.
This was an actual swing-long setup, one I traded and one I shared in my watchlist before the breakout.
Notice the stock has key levels of support and resistance. It had displayed notable relative strength to the market. It’s trending upward and consolidating above key rising moving averages. The breakout day had an uptick in volume and elevated RVOL. The length of the consolidation allowed enough energy to build up, increasing the likelihood of follow-through, and the tight range allowed for a fantastic R: R swing long opportunity.
Alright, now onto what I am sure many of you are most excited about. Let’s go over 3 of my favorite swing setups.
Starting with the Consolidation Breakout Setup
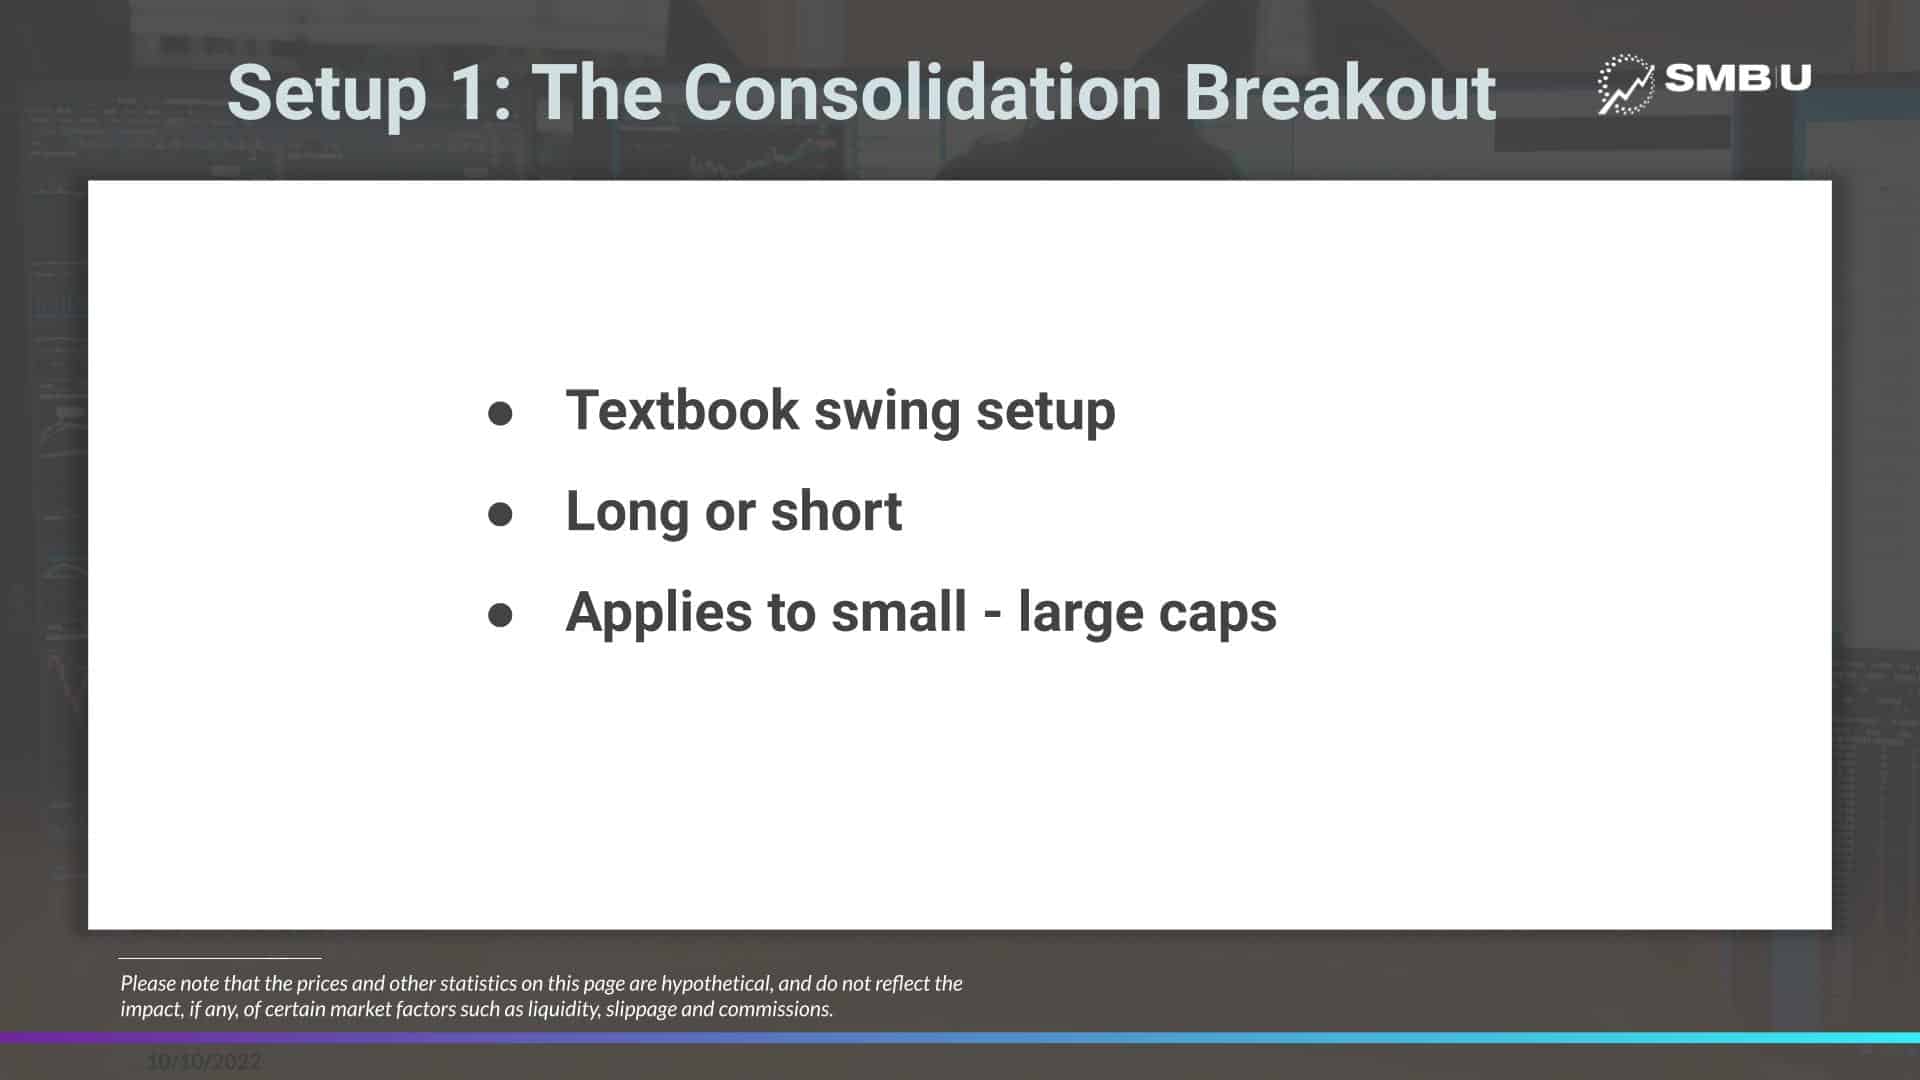
This is a textbook swing setup and perhaps the easiest one to identify. What’s also great about this setup is that it can be applied for both sides, long or short. So, it comes in handy in both a bear and bull market.
This is a setup that I have traded for many years now, in individual stocks long and short, ranging from small caps, along with sector theme plays, like AI, Bitcoin, and the pot stocks, for example.
But let’s go over a real-life setup, similar to the setups and charts I recently showed you in MSFT and NVDA, using an idea I provided months ago, just like I did for MSFT and NVDA ahead of their breakout in my watchlist so you can better understand this setup.
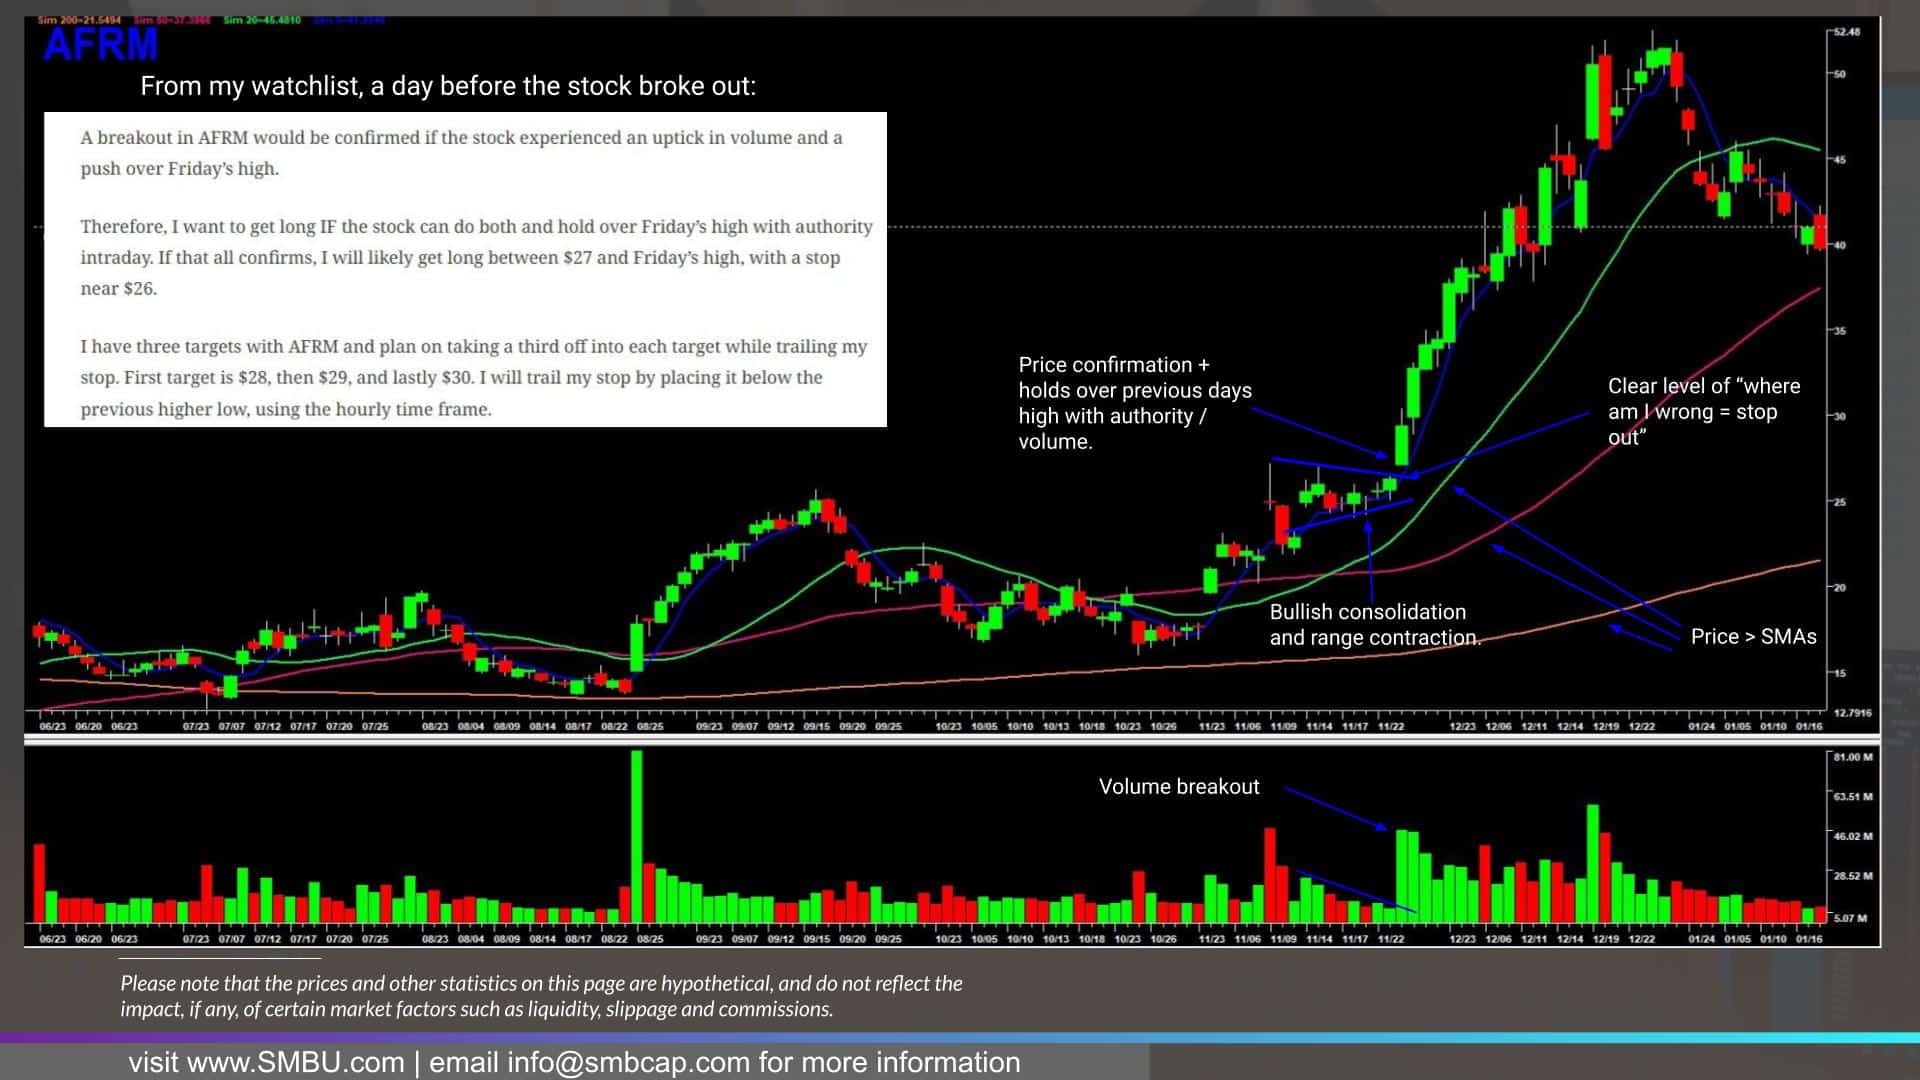
AFRM as an example:
So now that you have a solid understanding and certainly a clear foundation of this setup, How exactly do I manage this setup across all aspects?
Well, starting with how I set my targets: Remember, I mentioned that I am a discretionary trader relying heavily on technical analysis. Therefore, If a stock is breaking out, and there are clear levels of resistance ahead, those will naturally be potential targets and areas of interest.
But what about when I am trading this setup, and there are no obvious levels of resistance to act as targets?
That’s when I use an ATR. An ATR or average true range measures a stock’s true range over a specified period. So, if a stock has an ATR of 1, I can expect its range intraday to be $1 on average. If I buy a breakout, my first target to lock in gains and cover risk will be a 1 or 1.5x ATR up move, so looking for a $1 – $1.50 move higher. If the RVOL is significantly elevated after a long period of contracted volume, my first target might adjust to 2x ATR.
Now, how do I manage risk and my position?
These factors all work together.
Before I enter a position, I know where I am wrong. Where I am wrong in the position is where my stop loss goes. I also know where the stock can go. I have targets in mind, as discussed above. Either using ATRs or using levels of resistance.
Starting with that, I must have at least a 3 1 R: R to initiate the trade, but often it’s greater than that in reality.
Now, how do I manage my position and risk in this setup? I use multiple methods. Let’s look at the hourly chart of AFRM to understand this better.
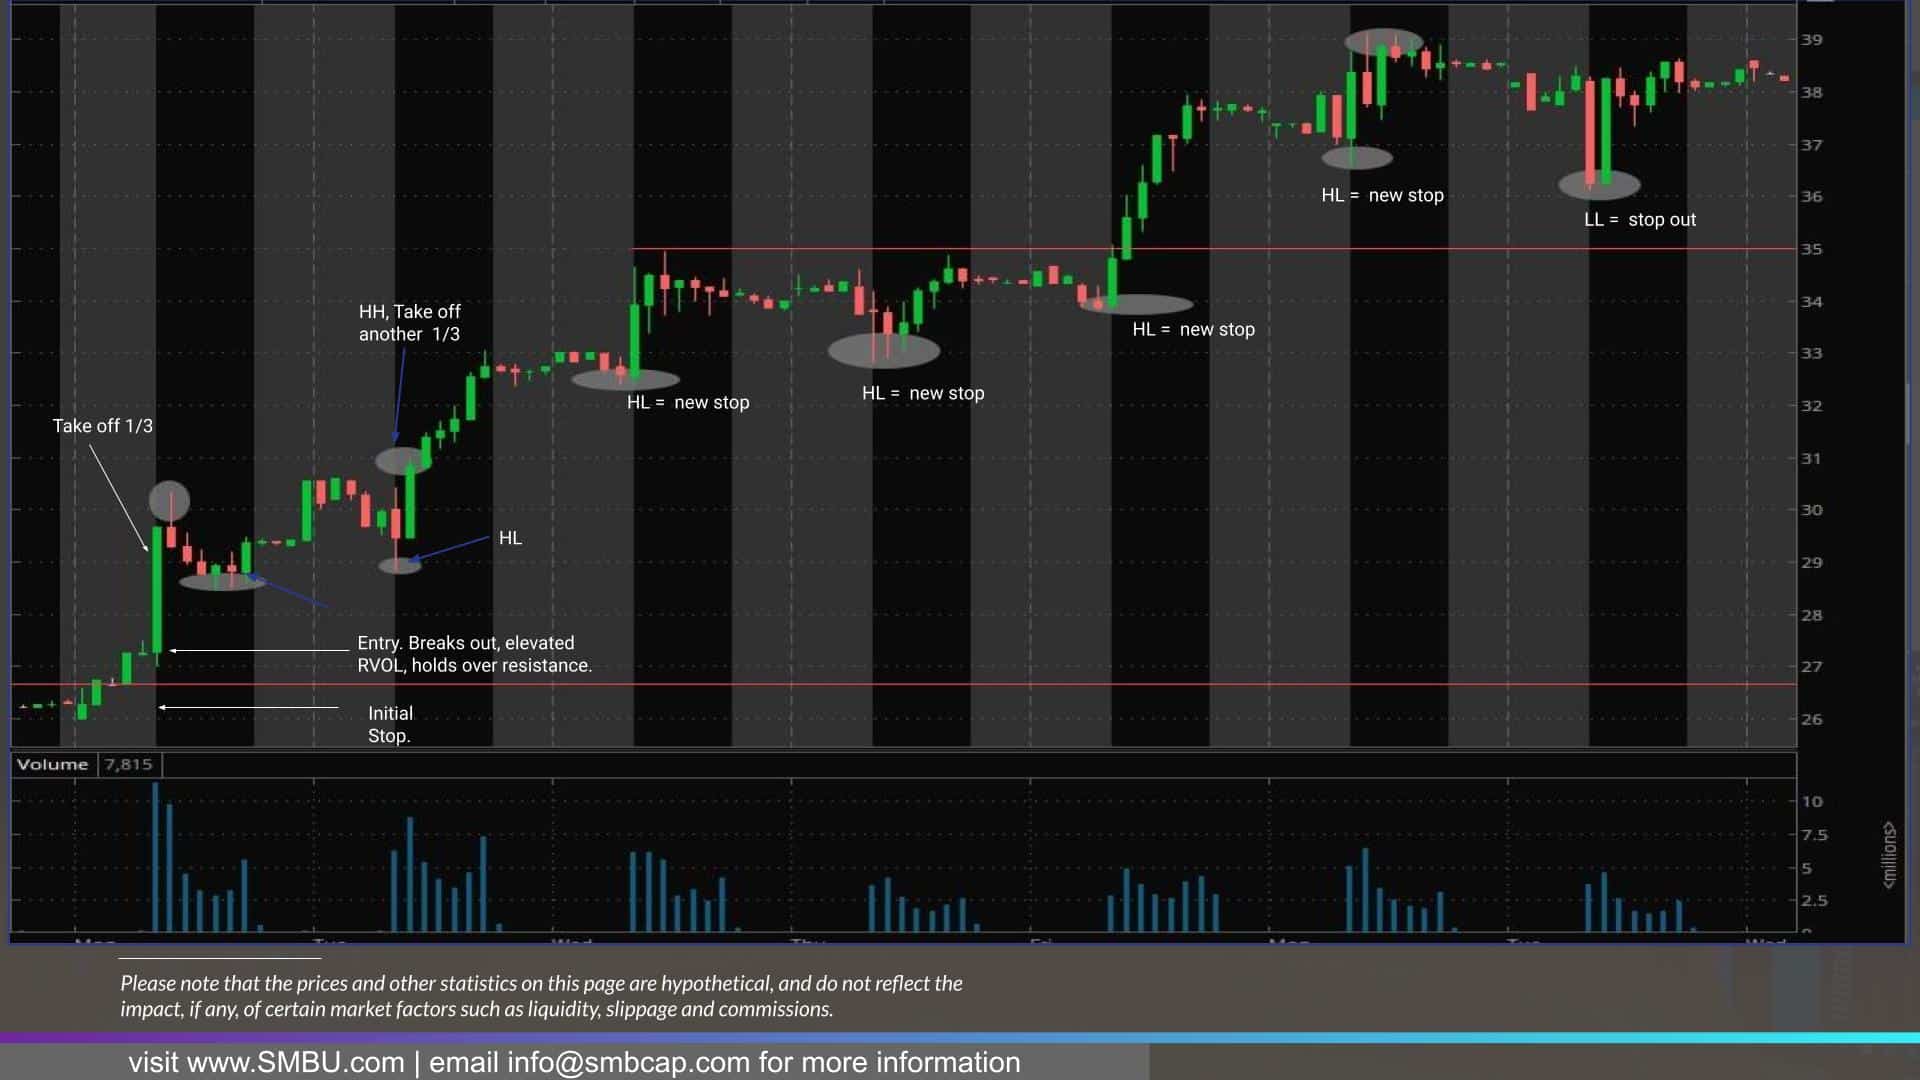
Entry over $27 after the stock broke above resistance, experienced abnormal volume, and held over the breakout zone.
Per the plan, the stop is near $26, so it is almost $1 away from the entry. Why? That’s where I believe the trade is no longer valid, and I am wrong because I would not want to see the stock re-enter the range after it broke out.
Given the enormity of the volume surge a 1 ATR plan, to $28 for covers did not make sense as laid out in the plan, so discretion should be exercised to stretch that to 1.5 – 2 ATR given the volume. Why? The stock is in play.
So, on the opening drive and first hour of action, the stock soars almost 10% into multiple targets. Take a third off into adjusted targets near $29.
Ok, now, from here, it gets interesting and really turns into a swing versus a day trade.
How is the rest of the position managed, and how will risk be managed?
I manage risk differently based on the setup and my aggression.
Something to remember, though, is that if I am trading AFRM on the hourly timeframe/chart, I need to manage the position and risk off of the SAME TIME FRAME. Due to liquidity, spread, or beta, I will manage some positions on the 5-minute or 15-minute chart. But here, I am using an hourly chart.
I like to use higher lows to trail my position on the long side. On the short side, I like to use lower highs. Just the opposite, right?
So, notice once ⅔ of the position has been taken off into targets, I can trail my stop using the higher low approach for an uptrend on the 60-min chart.
After setting targets to lock in profits and eliminate some risk, trailing my stop this way works well for me. I use this approach for multiple timeframes and even intraday trading.
What is key is to remember that the timeframe you are trading something on should also be the timeframe you are managing risk on.
Before I move on, are there other ways traders manage risk and trail their stops? Another popular method, similar to my approach, is using the VWAP anchored from the breakout day. If the stock begins to consolidate below, one can stop out. Another method is using the stock’s 5-day SMA.
Now, onto my second setup that I will share with you today!
The Mean Reversion / Backside Short / Dead Cat Bounce
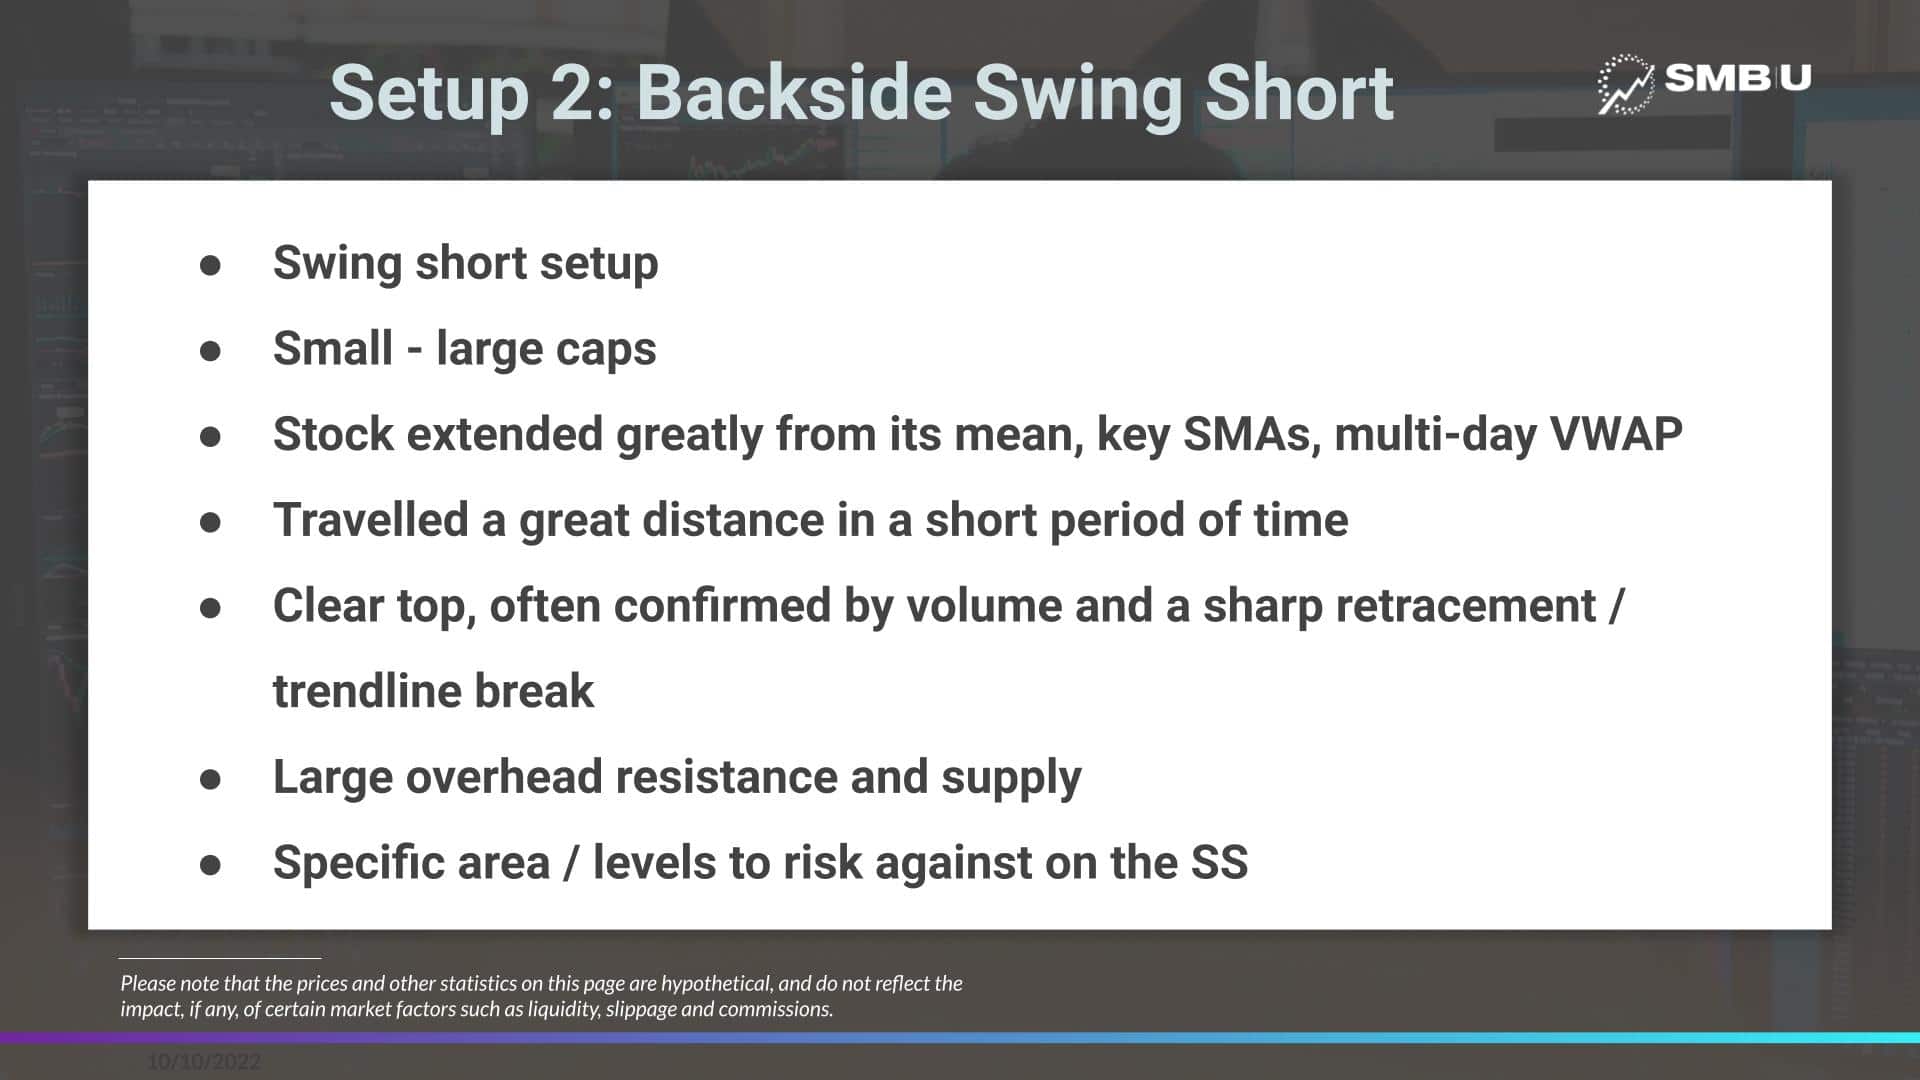
Next up, we have the Mean Reversion, or Backside Swing Short Setup, one of my favorites!
This setup also relates to small-caps or large-caps and is put into action when a stock has greatly extended from its average or mean to the upside, extending from its key SMAs / multi-day VWAP in a short period. Once a top has been put in, and a momentum shift occurs, i.e., the stock breaks its uptrend and/or the stock begins to make lower highs, I look for a pullback to the mean and/or a previous breakout level or significant level of support.
Now, this swing short opportunity can be applied in several different ways.
We’ve already looked through large – mid-caps, so let’s apply this setup to a smaller cap stock and one I shared previously in my watchlist and traded.
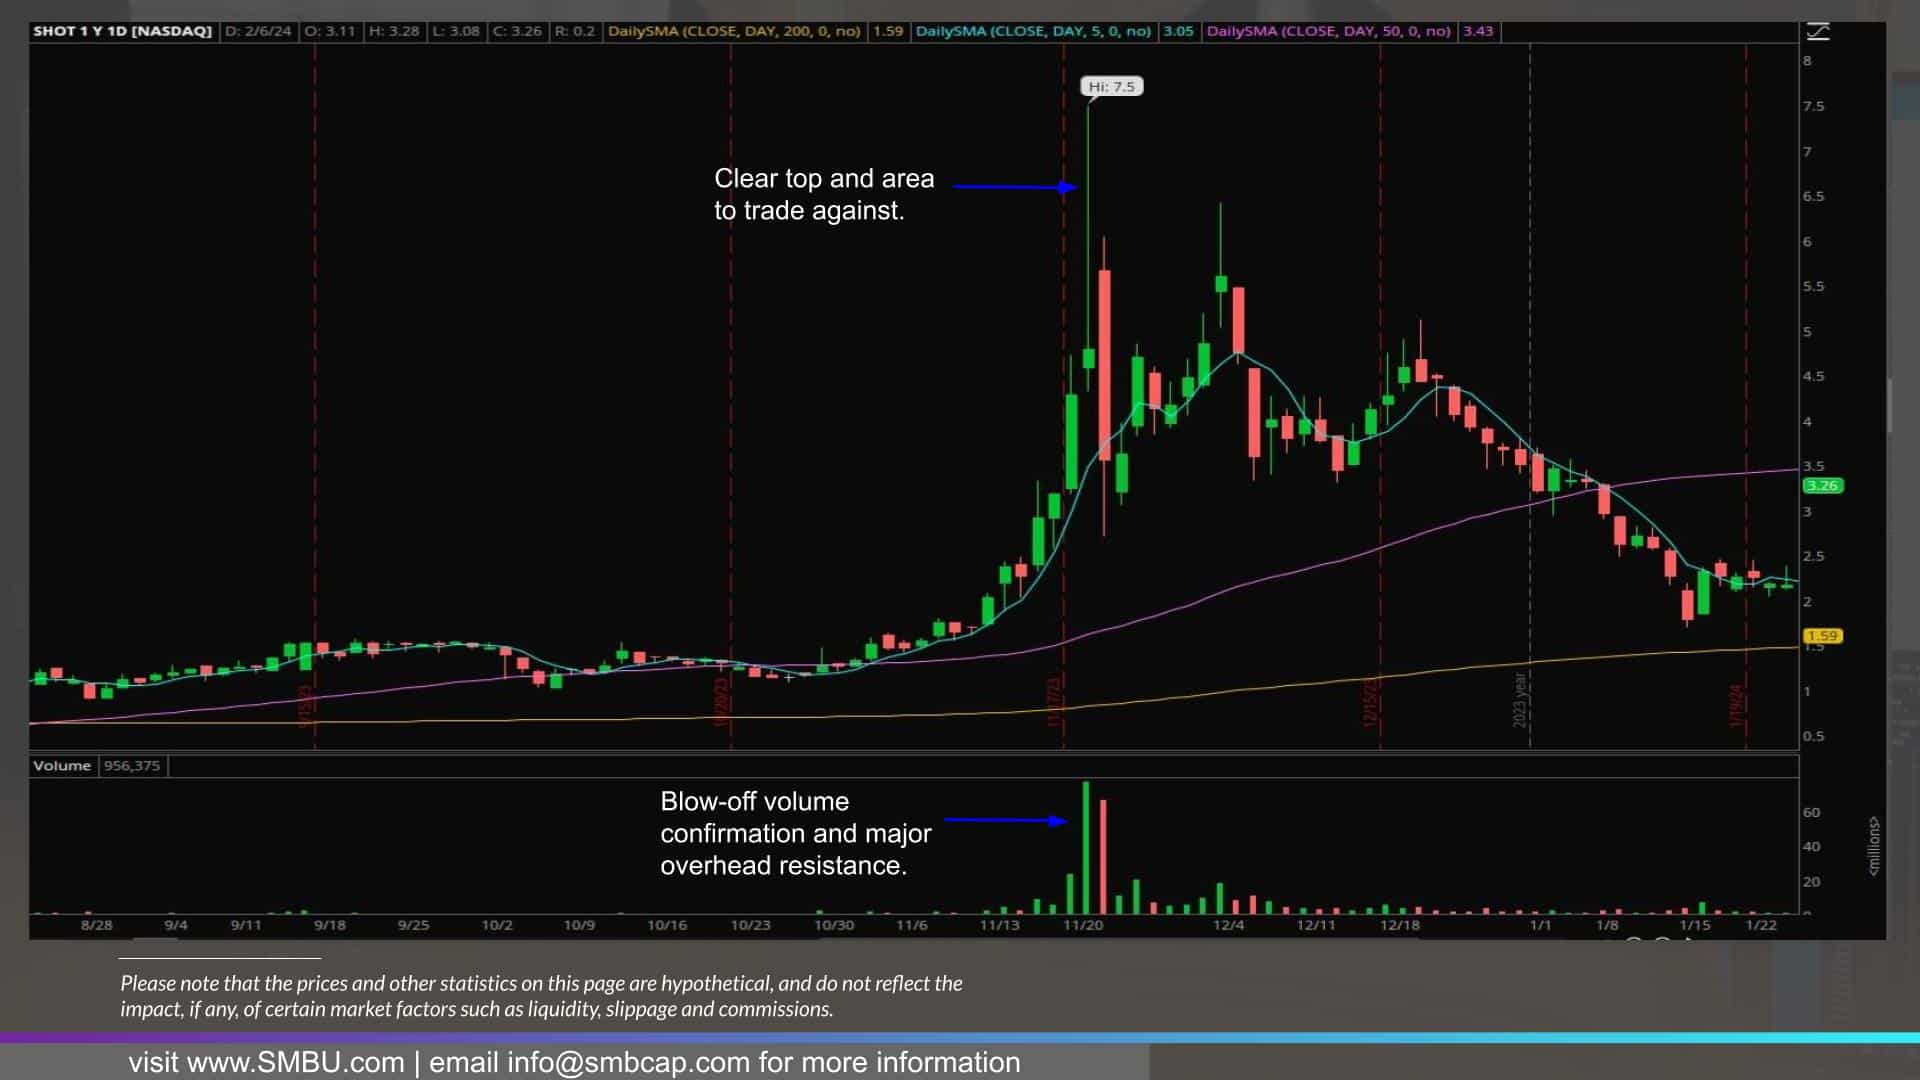
So, as I mentioned before, the idea always comes from the daily chart. So, let’s look at the daily Safety Shot chart. SHOT ran up for multiple days in anticipation of its launch after the company made an announcement. I perceived it to not be a fundamentally changing catalyst… rather, it became a trading vehicle and short squeeze, in my opinion. This is a small cap with a roughly 34m float and an average volume of just 6m shares.
So, on the daily chart, let’s see if this meets the criteria for a backside swing short.
Was the stock significantly extended in the short term? Yes. Had it extended from several key indicators, like its multi-day VWAP and SMAs? Yes.
Did the stock put in a significant blow-off top, confirmed by volume, and experience a momentum shift? Yes, it did.
After that, was there an obvious zone to base risk off of for a potential trade? Yes.
Now, there are various iterations of this strategy. For example, on day 1 of failure in a stock similar to this, from a technical and even fundamental point of view, I often short a lower high on day 1 for an intraday or multi-day swing.
However, a better starting point and one type of iteration of this concept that can be more easily applied to a broader basket of stocks is what we will go over today.
And that is identifying a stock, Like SHOT, which is firmly on the backside and on a higher timeframe, like the hourly chart, is bouncing back into an area of major potential supply, and therefore offering a potentially attractive risk: reward opportunity.
Think about it. What creates the lower high? Sure, there are shorts. But also, on a basic level, it is supply and demand. If 77m shares were traded on the day that this topped out, and many longs are stuck…. Suddenly, a week later, when the stock pops back into an area where those people may not be too stuck anymore, they will likely take this opportunity to sell for a minor loss and move on – creating significant overhead resistance and ultimately leading to a lower high.
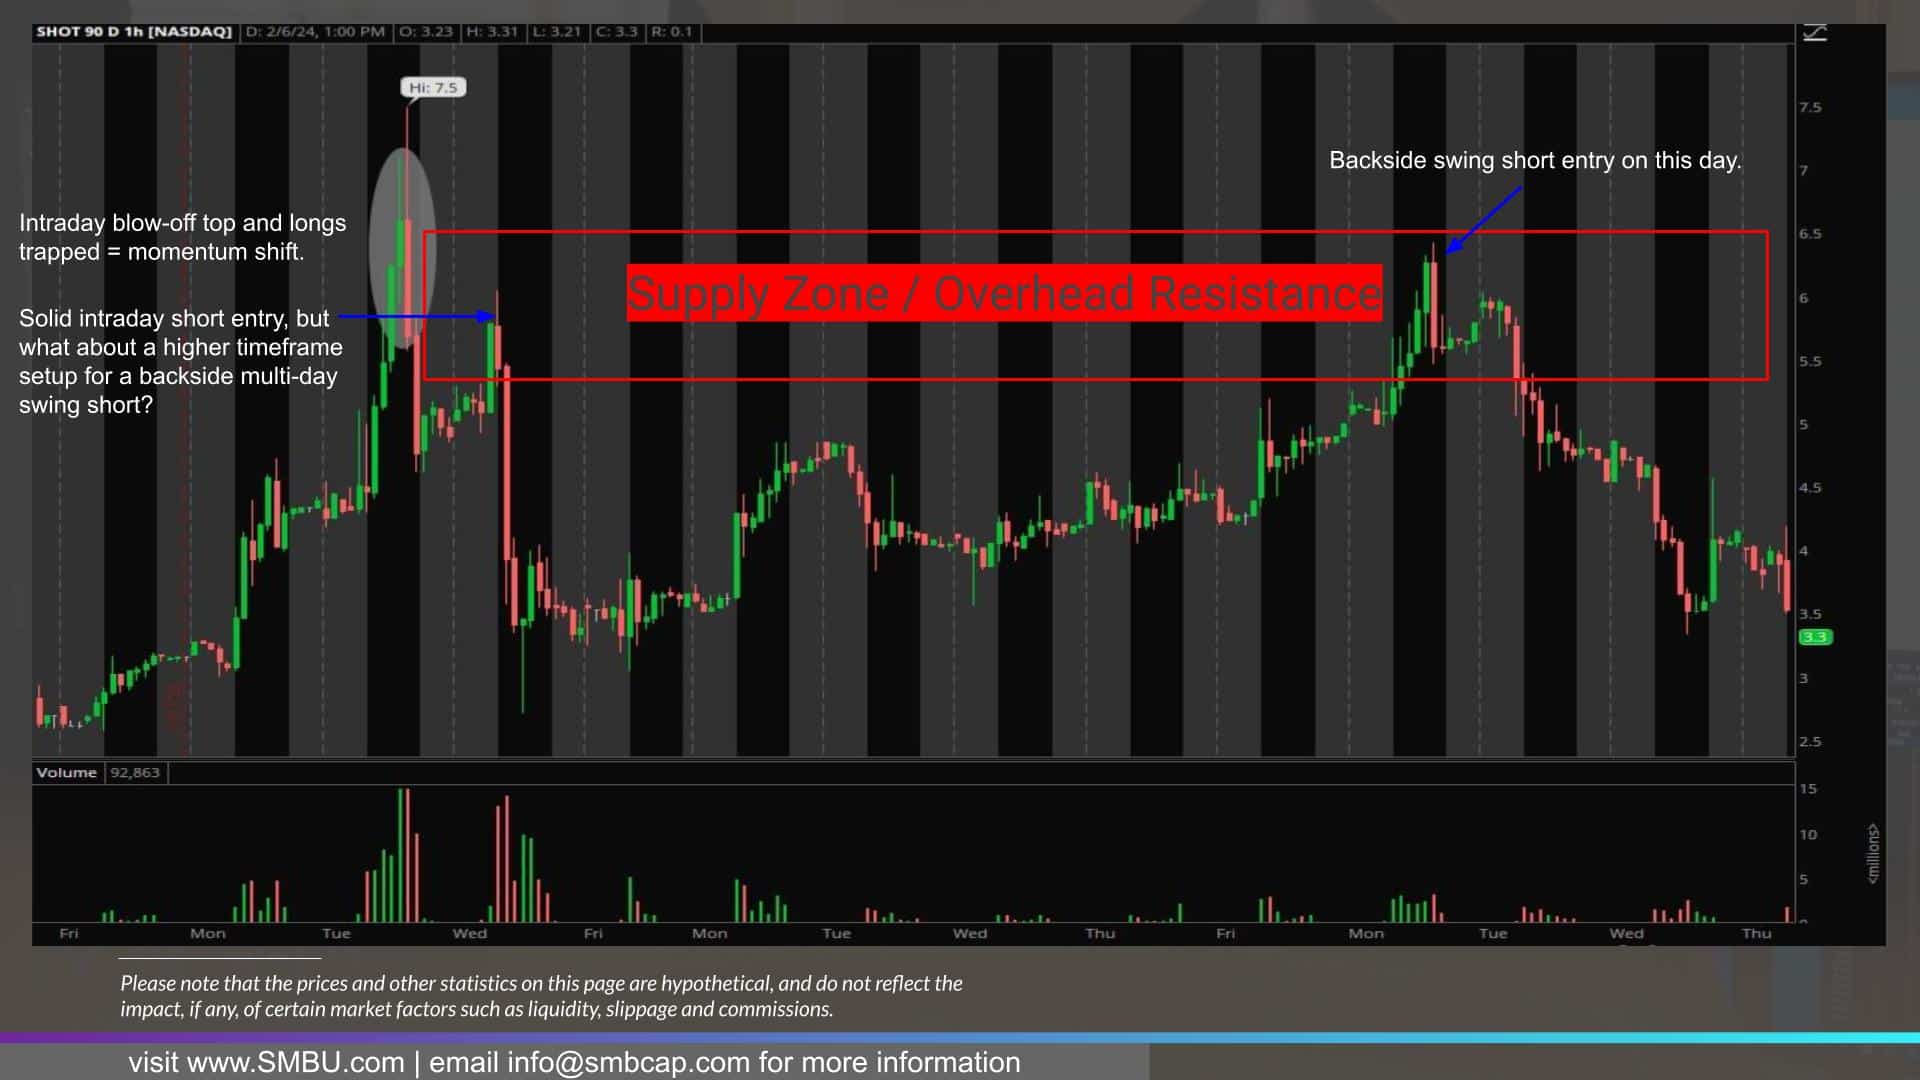
So what area would we want to see the stock push back into and fail in the future, after it topped out, for a lower high entry to short? It would be anywhere from $5.5 – $6.5 because it is where the majority of volume was traded on the day it topped and, therefore, where most of the supply would be.
Now, how is this position entered? You would like to see the stock push back into this area and fail, thereby confirming the supply/demand aspect and, more importantly, providing an obvious level to risk against.
So, let’s look at how this position would be entered and managed.
Now that we have an area of interest and the characteristics/variables of the setup are met – the focus goes to looking for an entry and price confirmation. So, let’s look at a lower timeframe and see what the entry and trade management would look like.
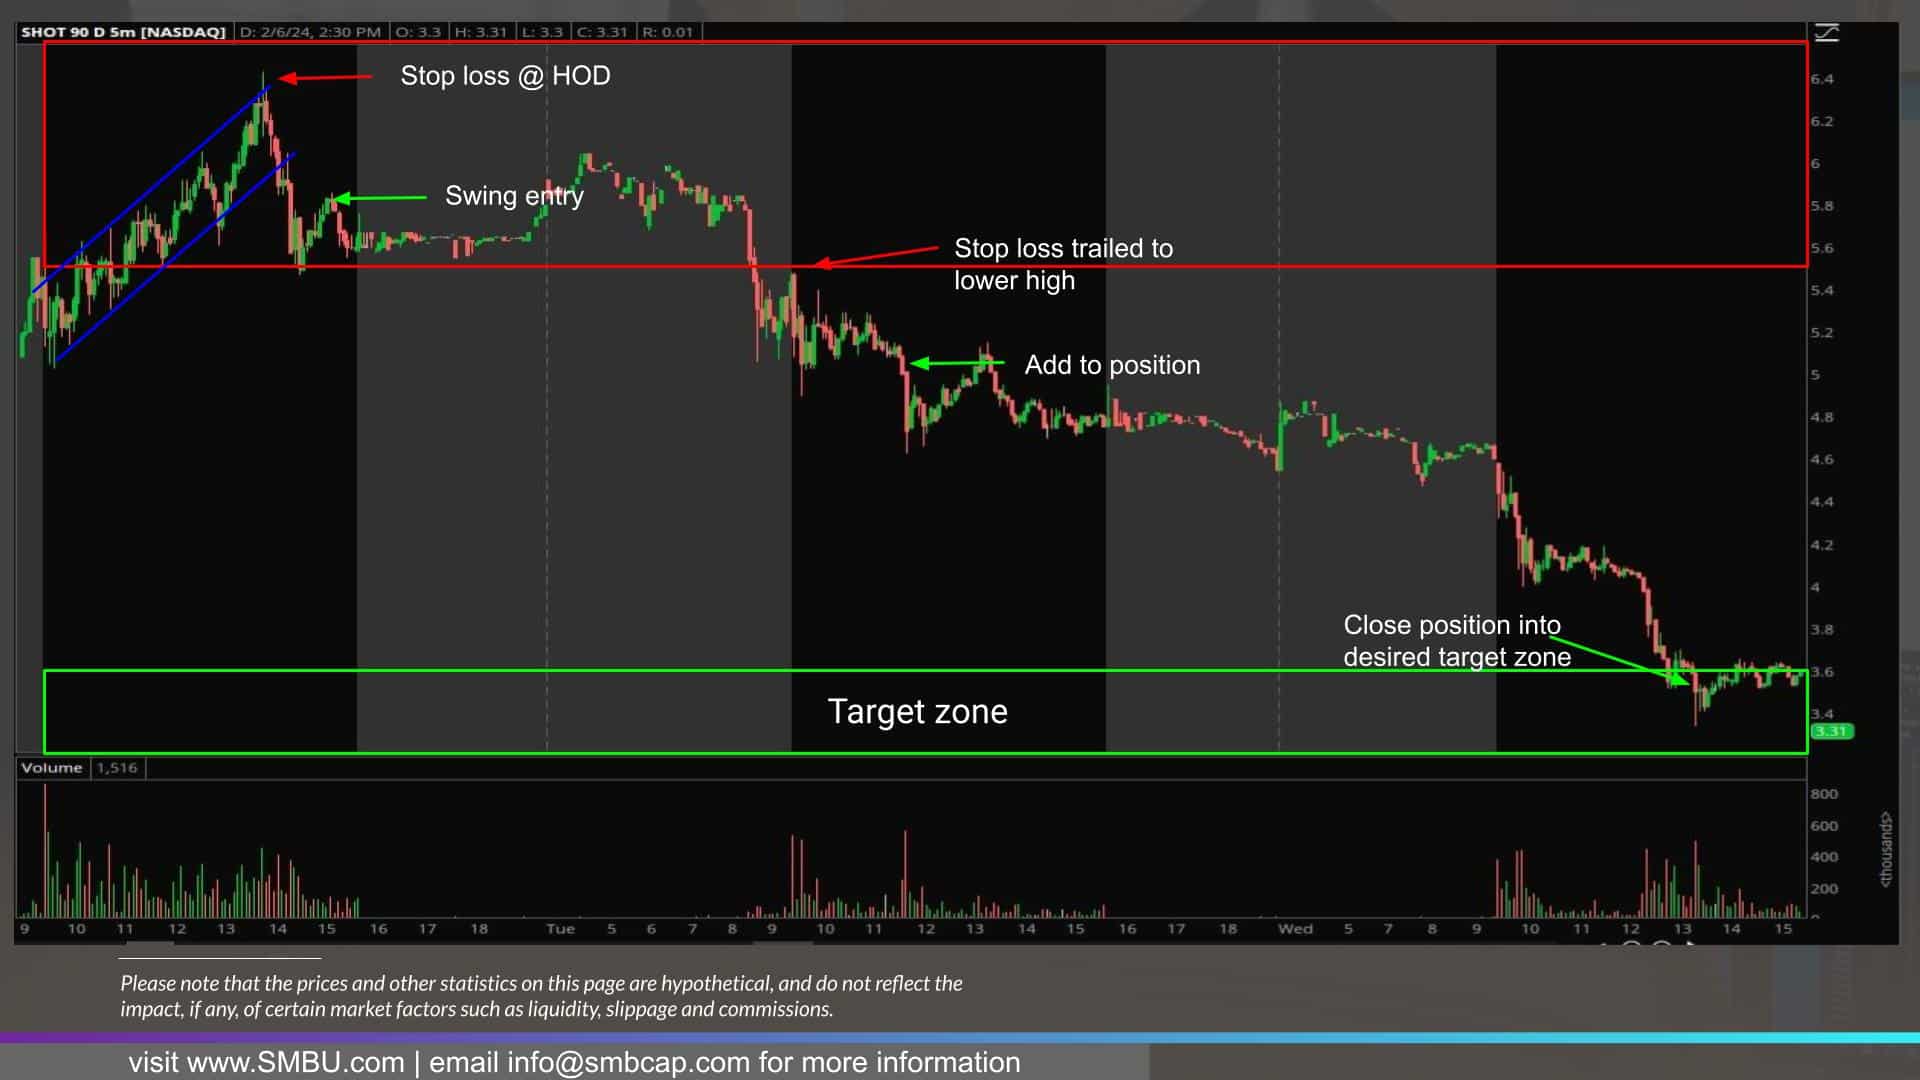
So, eight days after the stock topped out, it bounced back into the potential supply zone. Traded in a steady uptrend and then broke the uptrend near the end of the day, thereby confirming a level to trade against intraday, and now all that is needed is a pop back near that area to get a good R:R entry.
Just before the close, the stock popped back near $ 5.80, giving an entry for the short versus the day high for the backside swing short. I like to short lower highs because it not only signals a clear momentum shift but also gives the best possible entry after confirmation has been received.
So I short the pop, looking for a multi-day short swing, targeting a move to the mid-to-low $3s. Why? After the stock initially topped out, it found support in this area for two days before beginning its dead cat / secondary bounce.
So, how is this setup managed with an entry and stop loss in place? Well, with a short entry at $5.80 and a stop over the high of the day, the risk is about 60 cents. My target is mid $3s – an area of support. So I am risking 60c to potentially make $2.30 per share. An almost 4:1 R, so that meets the criteria.
So, the position is on, and the following day, the stock consolidates near the previous day’s low before breaking down, allowing for a great momentum add as price action is confirming a trend lower and immensely weak action. After that, the stop is trailed to the lower high, in this case, the day high.
The following day, the stock trades cleanly into the desired target zone, which is where the position should be covered.
Next Up: The Power Play Continuation
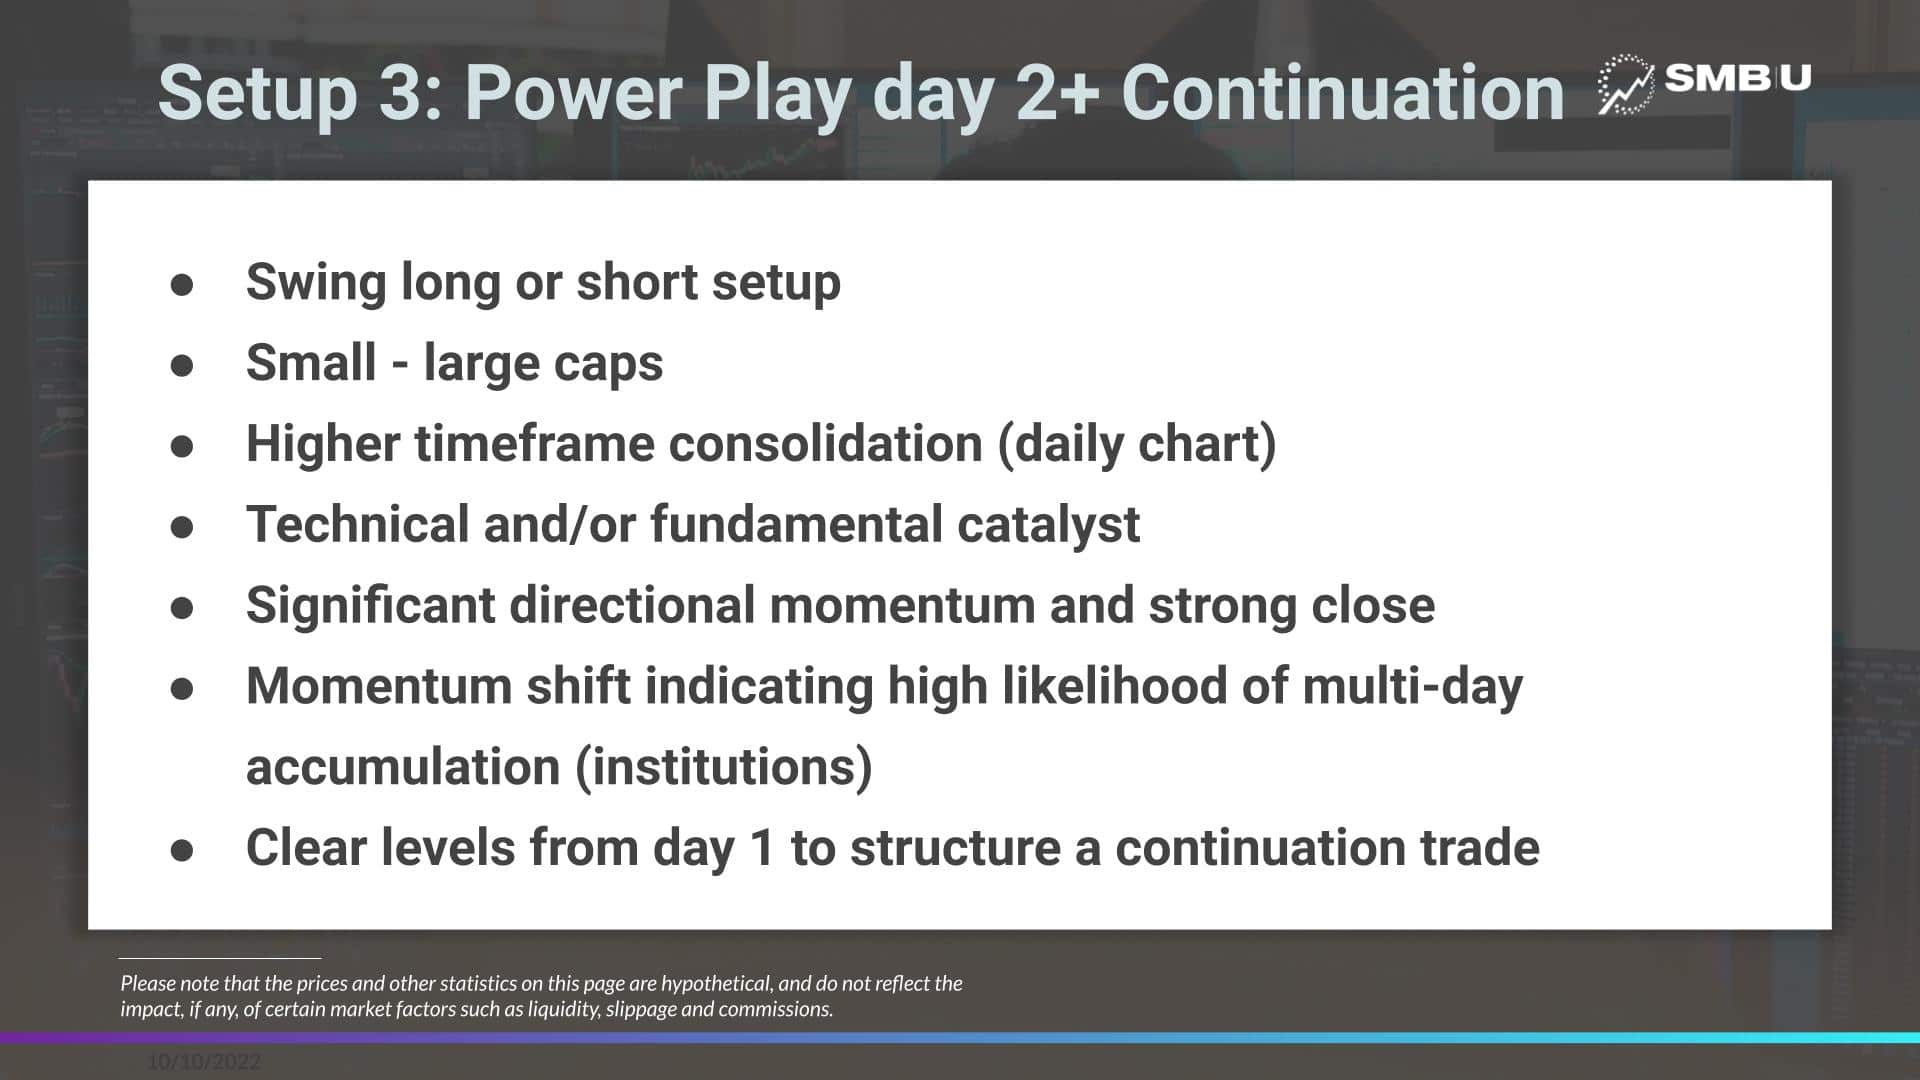
The third and final setup we will go over today is a day two + continuation move. The day two + continuation play follows a power directional move on day 1 in a stock, where the stock, thanks to a monster technical breakout and/or fundamentally changing catalyst, has a significant directional move and closes near the high end of the range. This applies to small-large caps and can be applied to both the long and short sides. It works particularly well during earnings season.
Importantly, for this setup, you want to identify key levels from day 1 – support and/or resistance levels, as well as previous days’ low and high. I also like to use the VWAP anchored from day one as a guide.
So, let’s look at a real-life example of this trade setup that I recently outlined in my free weekly watchlist.
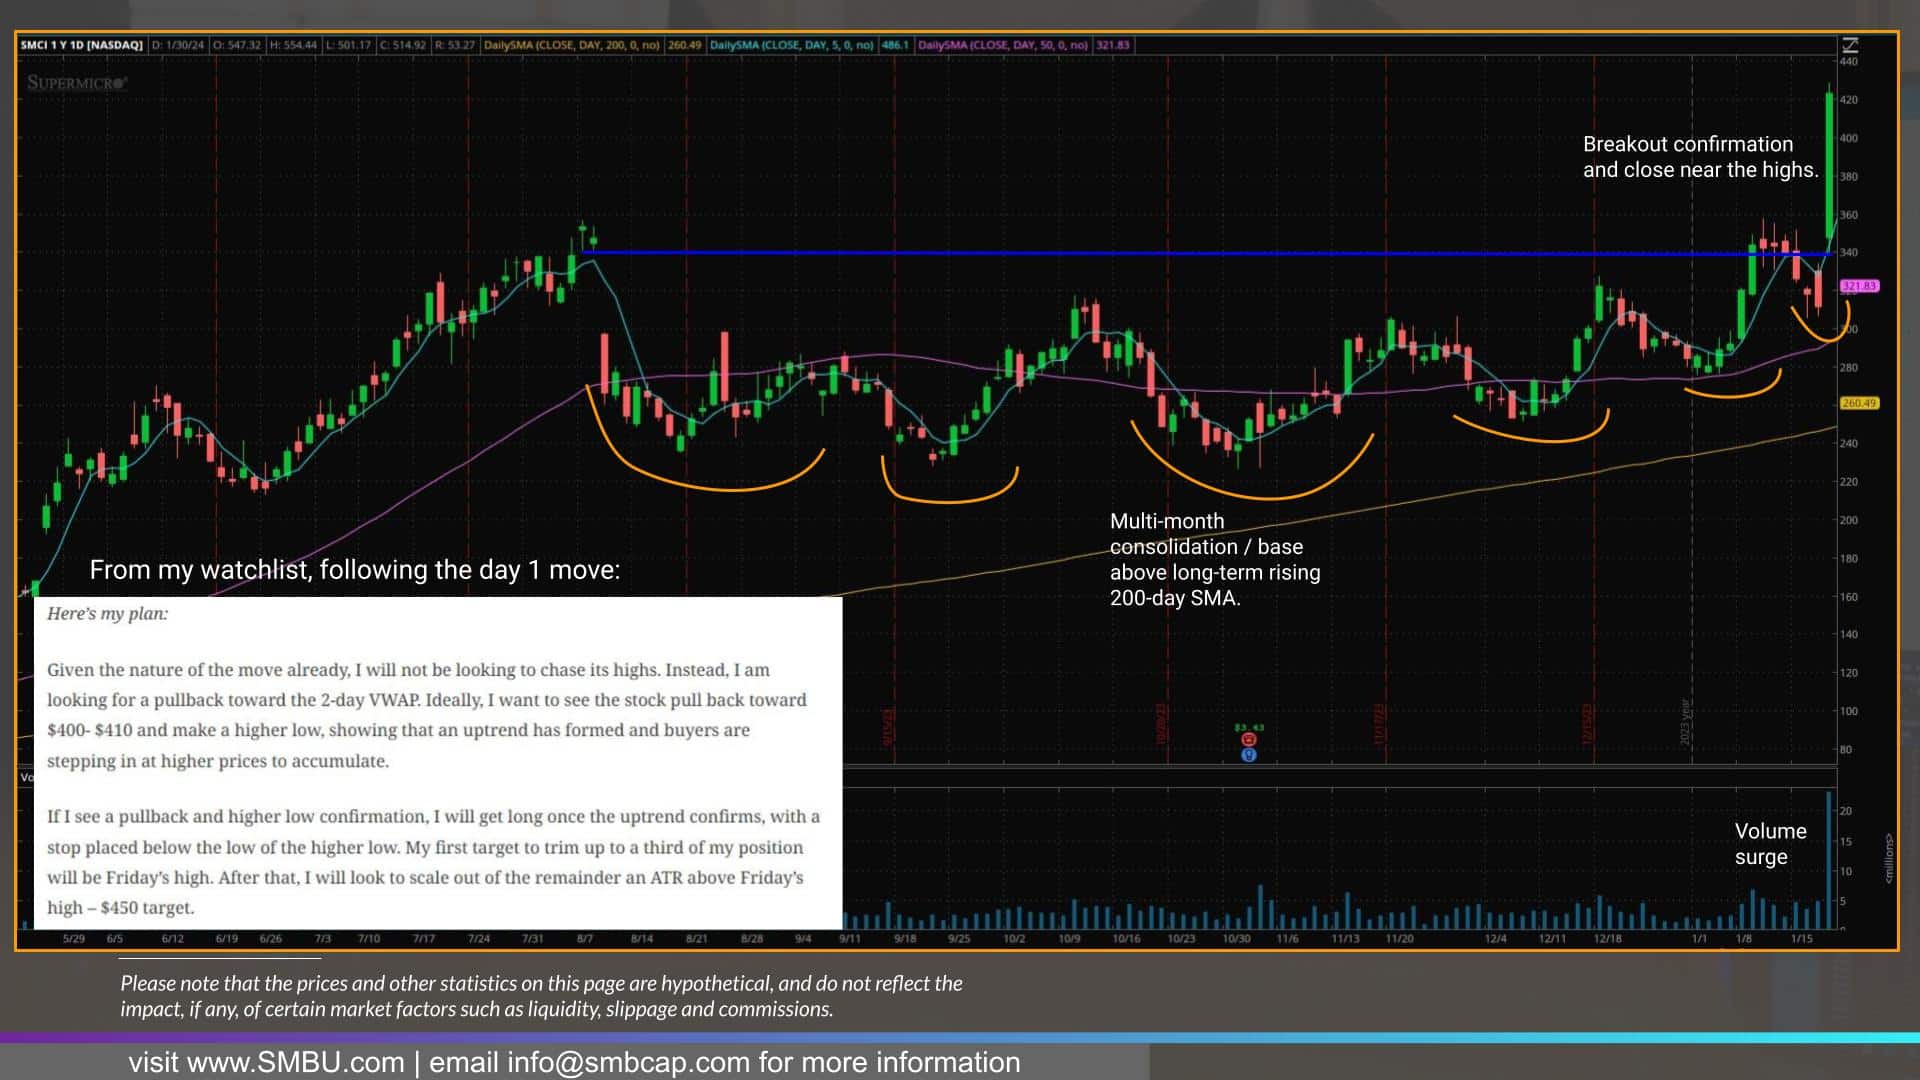
So we have SMCI, a name in a hot sector – semiconductors – that pre announced some highly impressive figures ahead of its earnings. So we have a name in a hot sector, breaking out of a lengthy base above a massive resistance zone, hitting new highs on fundamentally changing news, surging volume, and closing near the day’s high. A prime candidate for a swing entry on day 2 using levels from day 1 for a continuation swing.
As I outlined in my watchlist over the weekend, ahead of day 2, I was looking for a move into levels from day 1 – 400 – 410 – the support from day one and where the two-day VWAP would form on day 2.
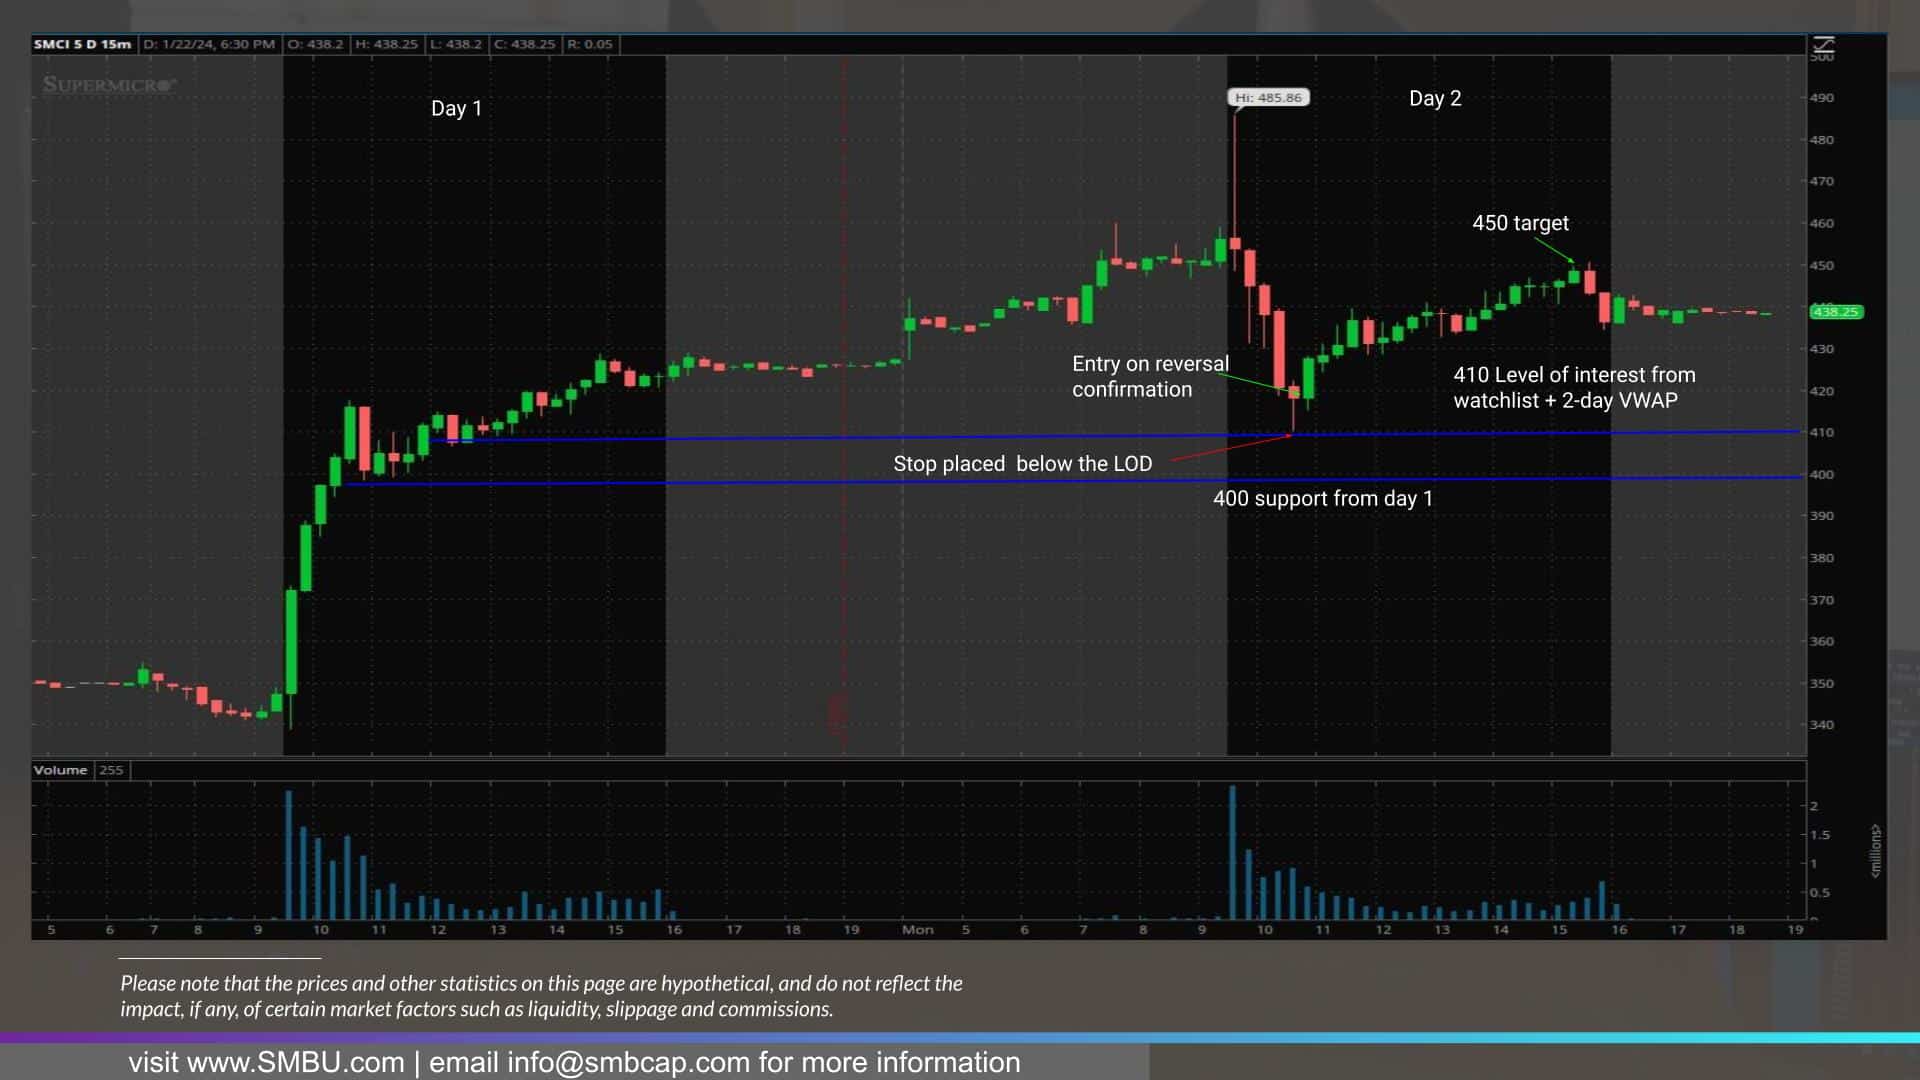
Following a morning dip and likely some hefty profit-taking, the stock sharply reversed off this support zone, marking a clear low of the day and intraday bottom – that reversal was confirmation of support and signal for long entry, with a stop placed below the low of the day.
After that, the stock trended higher into the close, reaching the target from my original plan: $450.
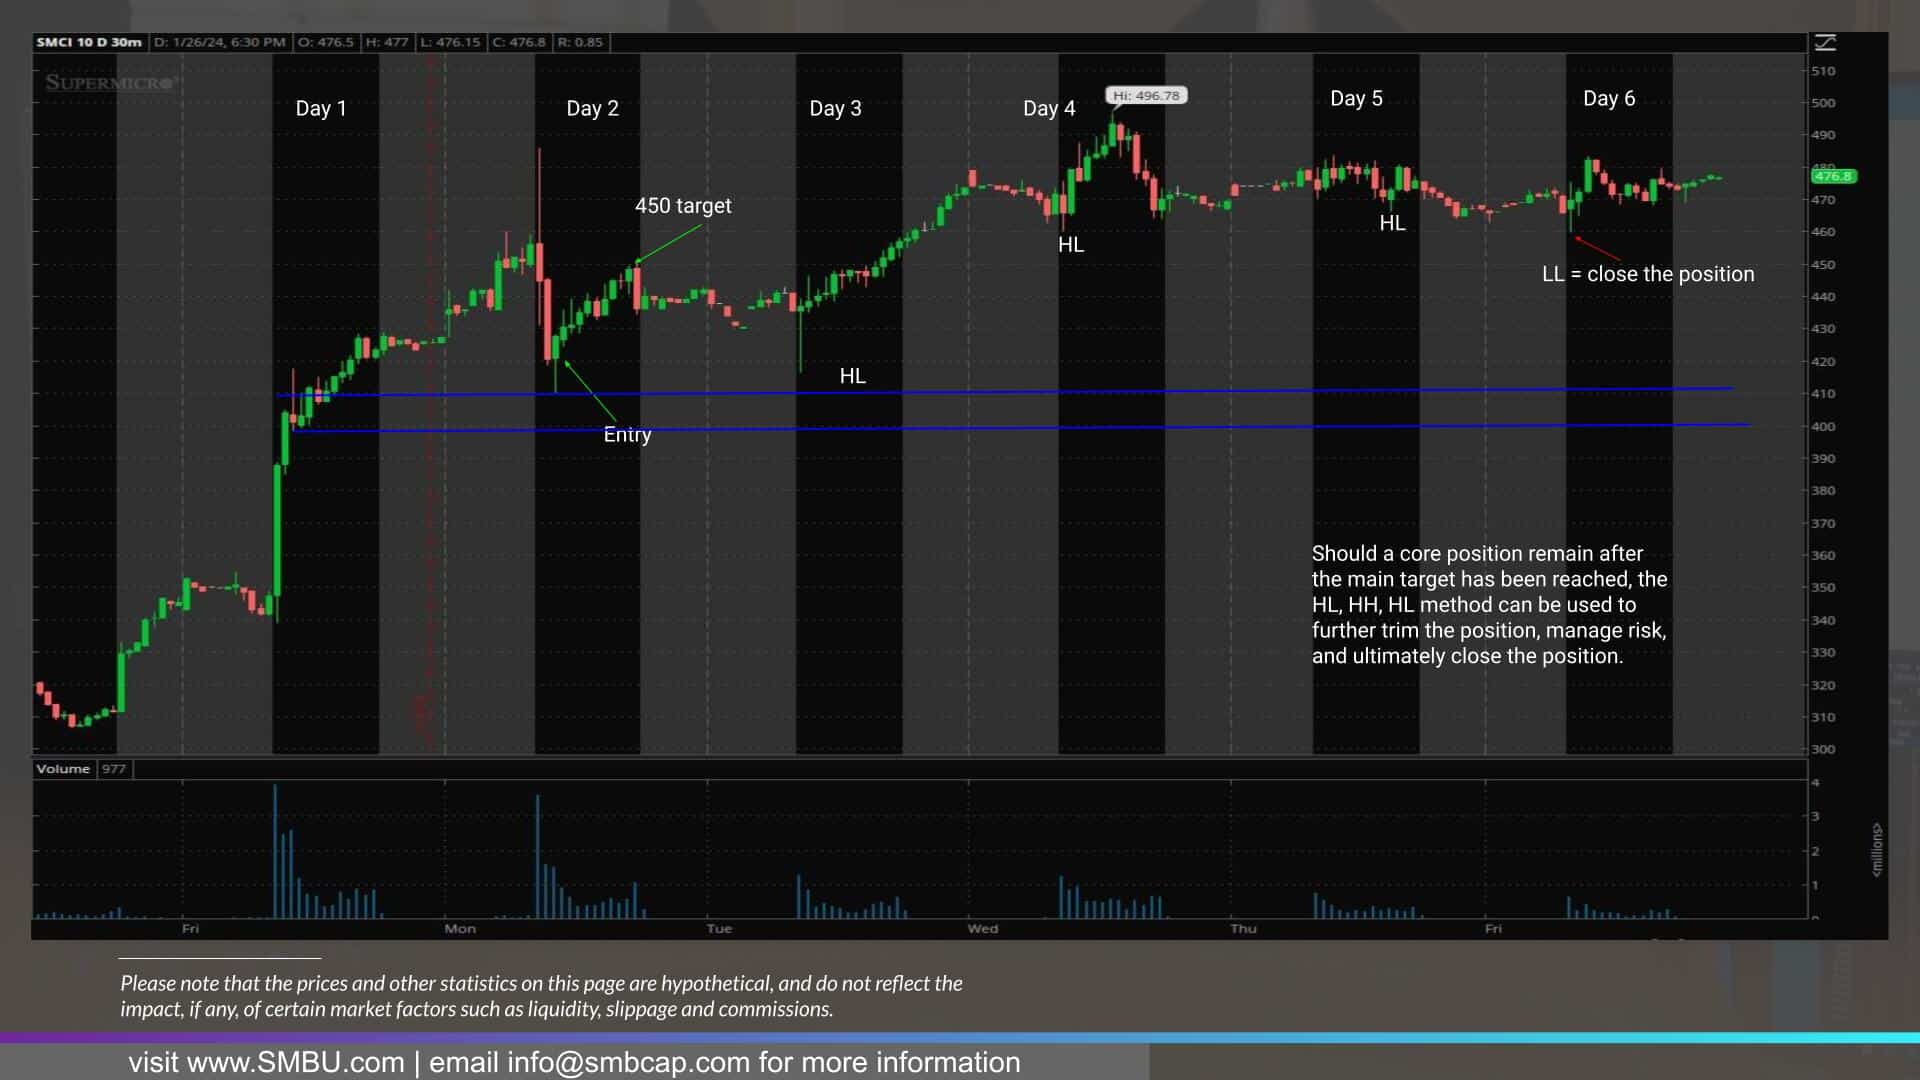
But how could this position have been held longer using a trailing stop to capture more of the move on a higher timeframe, given the target was reached somewhat unexpectedly in 1 day?
Similar to the example outlined in AFRM – as the stock makes new HHs, the position could be trimmed further, locking in gains while trailing the stop using the day low / higher lows. Enforcing that technique would have meant that the position would have been closed on day 6 when the stock took out the previous day’s low and made a brief LL. In this example, another option for trailing a stop could be using the anchored VWAP from day one and exiting the position once the stock fails to remain steady above it.
In Conclusion,
Traders, I hope you all enjoyed this in-depth guide and introduction to the world of swing trading and a walkthrough of some of my favorite setups that apply to various stocks in various market environments, both long and short.
For those willing to dive deeper into the amazing world of swing trading, you can check out an example of a weekly video I released previously and sign up to receive my weekly watchlist for free.
It shows the principles highlighted here in action, but even more, it provides some additional, more advanced commentary about that particular setup.