
Indicator Description:
The Red and Green colors are based on the market cycles:
- Dark Red: Accumulation
- Bright Green: Mark Up
- Dark Green: Distribution
- Bright Red: Mark Down
- Blue: Volatility Consolidation
Here’s a simplified image of these cycles:
Sign up for the SMB Systems mailing list to be notified when the indicator is available for additional trading platforms.
If you have the ability to convert this for other trading platforms, please send your code to [email protected]. Thank you!
TOS Instructions
Many thanks to John Chernicky for transcribing the code from EasyLanguage to thinkScript!
1) Open ThinkOrSwim Platform
2) Click on “Setup” (upper right corner)
3) Click on “Open shared item…”
4) Paste this URL: http://tos.mx/DUZDmM
5) Go to a chart
6) Click on Studies >> Edit studies…
7) Find the indicator and add it
Instructions for TradeStation and Multicharts
1) Copy the Code Below
2) Paste Into a New Analysis Technique (Indicator)
3) Compile (Press F3 on your keyboard)
4) Insert the analysis technique onto any chart
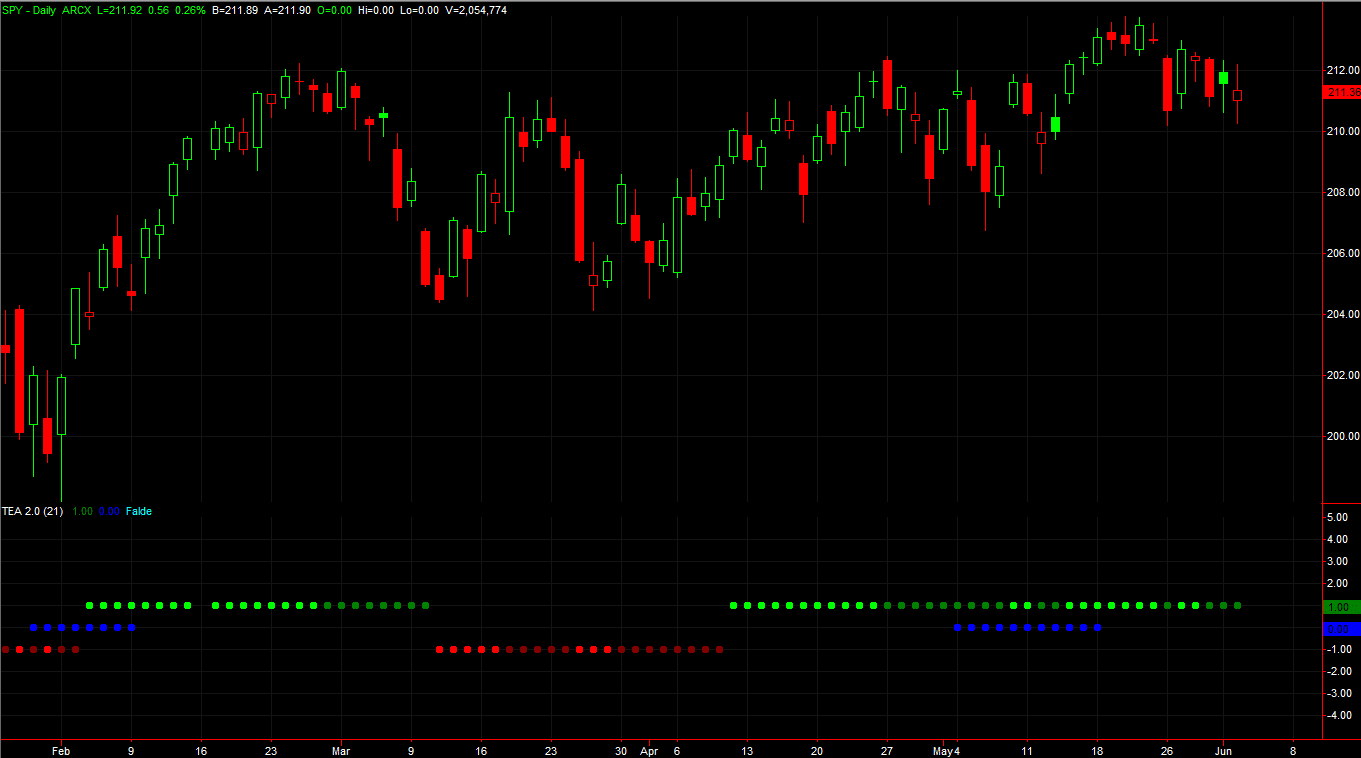
5) Format the analysis technique and change the style to be points with a heavy weight
It should look something like this when you’re done:
Here’s the code for TradeStation and Multicharts.
{START COPY HERE
Coded by Andrew Falde | 2015
Copy and Paste This Entire Code Into a New Indicator}
Inputs:
 LB(21);
Vars:
 Squeeze(0),
 Trend(0),
 TrendLine(0),
 Expansion(0),
 Signal(0);
Squeeze = ((AvgTrueRange(LB) * .75) - (StandardDev(C,LB,2)));
If Squeeze < 0 then Expansion = 1
 Else Expansion = 0;
TrendLine = LinearRegValue(c-((Highest(H, LB)+Lowest(L, LB))/2
 + xAverage(c,LB))/2,LB,0);
Plot5("Falde","AF",Cyan);
If TrendLine <= 0 and TrendLine > TrendLine[1] then Trend = 1; //Accumulation
 If TrendLine > 0 and TrendLine > TrendLine[1] then Trend = 2; //Mark up
 If TrendLine > 0 and TrendLine < TrendLine[1] then Trend = 3; //Distribution
 If TrendLine <= 0 and TrendLine < TrendLine[1] then Trend = 4; //Mark down
If Trend = 1 then plot1(-1,"Signal",DarkRed);
 If Trend = 2 then plot1(1,"Signal",Green);
 If Trend = 3 then plot1(1,"Signal",DarkGreen);
 If Trend = 4 then plot1(-1,"Signal",Red);
If Expansion = 0 then plot2(0,"Consolidated",Blue) else noplot(2);
{END COPY HERE}
Would you like to learn how to build custom indicators, signals, and filters? Click the banner below to learn how you can build your own tools.
One Comment on “TEA 2.0 Indicator”
What do the blue dots mean?