
We have one more major thing to look at as we build out our casino—volatility. We know the house edge for every game, but we also need to know some basic statistics before we open the doors of our casino. Let’s just focus on standard deviations for this discussion and how they affect our returns, and the bettor’s returns.
| Game | House Edge | Volatility (Standard Deviation) | Hands Per Hour | Revenue Per Hour Per Bettor | Revenue Per Hour |
| Baccarat | 1.2% | 1.0% | 72 | $8.64 | $86.40 |
| Black Jack | 0.8% | 1.2% | 70 | $5.60 | $28.00 |
| Craps | 1.6% | 1.1% | 48 | $7.68 | $76.80 |
| Roulette | 5.3% | Bet Dependent | 38 | $20.14 | $201.40 |
Let’s use Craps as the example. At one standard deviation which will encompass about 68% of all possible outcomes, the range of the edge becomes 0.5% – 2.7%, or in other words, for every $10 that the better places, he can expect to lose somewhere between $0.05 – $0.27, with an average loss of $0.16. Stretching it all the way out to three standard deviations which encompasses 99.7% of all outcomes, the range becomes a $0.17 gain to a $0.49 loss. And of course there will always be the very big winner, but that doesn’t change the overall statistics.
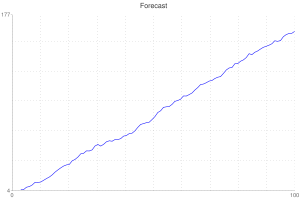
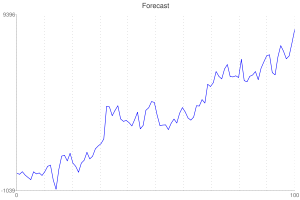
So what might a P&L curve for the casino look like with 100 rolls of the dice? It is almost a straight line using a trade generator, which of course is what the casino likes. And it is also what we like in building a trading system that will try to emulate a casino, but it is a lot harder to achieve than the fixed odds of rolling the dice.
So here is what too many bettors ignore: If they bet over and over again, the average edge is what they can expect—they will on average lose $0.16 per every $10 they bet. Yes, there will be winning strings and losing strings, but in the end it will average a $0.16 loss per roll and their loss will look pretty much like the casino’s P&L curve in reverse. And what about all those betting systems like Martingale, reverse Martingale, and countless others? All they can and will do is either slow down or speed up the rate at which the bettor loses all his money—or even cap how much he can win while leaving the risk of losing it all intact. The odds don’t change, only how the bets are placed, which in the trading world is simply called money management.
In our world of trading, the risk of ruin comes down to leverage combined with the statistics behind our trading system. Of course we must have a positive expectancy which the bettor never has (remember, we are the casino, not the bettor) or we wouldn’t be trading our system, so the question is how much money should we have in our account and what is the proper position size for the inherent risk of our system. We’ll go into all the statistics in a future article, including position sizing, but want to limit our focus to average returns and standard deviations—volatility—for now..
Let’s look at two different scenarios—both using a simulated account from one of our FX trading systems:
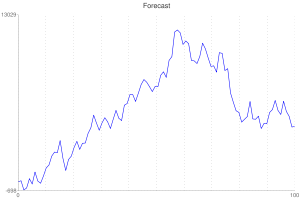
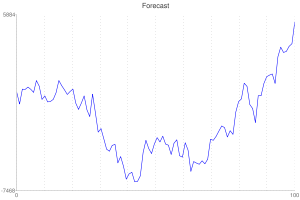
1) The first is a basic trading system that makes OK money trading EURUSD in a simulated account (we’ll use just one contract for these examples), but it is pretty volatile, so using leverage as is the norm in the FX world could easily wipe out our account. In this case, our average gain is $29.83 per trade (unleveraged) with a standard deviation of $802.52. Using these numbers, we can use the trade generator to simulate what a P&L for 100 trades might look like—a couple of different runs with each individual trade outcome generated totally at random using the average and standard deviation. Don’t focus so much on the ending amounts which are comparable, but rather on the paths we take to get there.
These are wildly different equity curves, but both are possible with the average return and standard deviation pair. Would you trade it? Hopefully you answered NO after looking at nothing more than the draw downs—there would be a lot of sleepless nights even without leverage.
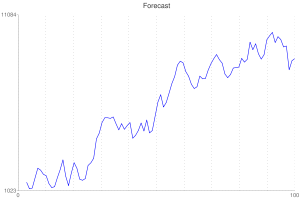
2) So how can we make it better—a lot better? The first thing we want to do is to squeeze out as much volatility as possible since we really do want to use leverage without running a high risk of ruin, so we tested many combinations of stops and targets and ended with a strategy that scalps fairly often, uses relatively tight stops, and consistently has a positive return. Boring—yes, but as we have said before, boring is good. Same underlying signals with an average gain of $80.06 and a standard deviation of $405.59. Let’s look at just two cases from the trade generator—you’ll get the idea.
The total returns are better which is great, but even better is that the equity curves are much smoother and predictable which gives us more opportunity to use some leverage to really enhance returns while keeping the risk of ruin in check.
Let’s summarize for a minute where we are on our path to building a trading system:
1) It all starts with an idea
2) That we turn into a set of rules
3) And test the dickens out of. It is pass/fail—no grading on the curve here
4) If it works OK, then we have to be sure it is robust—any asset, any market condition, any timeframe, and a random selection of stocks, FX pairs, etc
5) We MUST have a positive expectancy or we are guaranteed to lose all our money—the only question is how fast
6) There will be a sweet spot for our strategy—we want to make sure it isn’t too narrow or changing market conditions will take us under
7) Watch out for volatility—it can turn an otherwise robust trading system into a path to ruin
What comes next?? Lots of examples as we expand on each of these items and many more. We will be starting a free webinar soon to explore topics in more depth than we can in our blog. Please tune in as often as you can.
Author: Rick Martin
For more information or answers to your questions, email Rick at [email protected]
Hypothetical computer simulated performance results are believed to be accurately presented. However, they are not guaranteed as to accuracy or completeness and are subject to change without any notice. Hypothetical or simulated performance results have certain inherent limitations. Unlike an actual performance record, simulated results do not represent actual trading. Since, also, the trades have not actually been executed; the results may have been under or over compensated for the impact, if any, of certain market factors such as liquidity. Simulated trading programs in general are also subject to the fact that they are designed with the benefit of hindsight. No representation is being made that any portfolio will, or is likely to achieve profits or losses similar to those shown. All investments and trades carry risks.
We hold no relative positions in any of the securities mentioned.

4 Comments on “How To Lose All Your Money”
Rick, good post. When you back test a strategy what is your minimum amount of trades / time back before you have at least some confidence in the results?
I have been doing some testing recently on some mean reversion EOD strategies and they work great from 2007 to 2011 but from 2002 to 2006, they SUCK. There are enough trades in both periods to be valid result in my opinion. Have you come across this kind of thing often?
Thanks
Jerry
Hi MIke
I’m no statistician, but they tell me that you need a minimum of 30 trades to be able to use statistics that depend on a normal bell shaped curve–standard deviaiton being the biggie. And you hit on one of the keys to a successful trading system–ideally it will work in all market environments, but some will be better than others. We’ll talk about how to deal with that after the new year–not as tough as you might think !!
Rick
Rick,
Hey just a couple of points. Why would you use a bell curve if market return are lyptokurtic?
Also ‘ In this case, our average gain is $29.83 per trade (unleveraged) with a standard deviation of $802.52. ‘ Given these numbers we would get a Z-Test score of .04
ideally we like to see Z-Test score of 1.5 or 2 before thinking a system might be real… how sure can we be that the mean return isn’t 0 and you just got lucky to be > 0?I assume these returns are simulated correct?Thanks for the clarification.
Your posts are great to read. As a discretionary trader it is making me question how I am approaching my trading business. Thank you and keep up the great work.