In this video learn how to identify trends in stocks. Ryan, a SMB Senior Trader, offers advice to an intern on an earnings trade. You don’t want to miss the invaluable exchange between the two.
View Video Transcripthey guys ryan here senior trader from
smb
capital in this video watch an intern
present his playbook for earnings
and throughout the video you’ll be
hearing me chiming in with some comments
questions advice and feedback relating
to process
discipline risk management trade
management and more
i hope you enjoyed this video cheers
[Music]
i’ll be doing a playbook on earning
seasons identifying trends
this is a little bit packed information
so i’m going to try to make it as
concise as possible so just an overview
this trade is going to highlight how to
identify high quality earnings to trade
for day one moves
and then go over variables to study and
keep track of
and then from that um
i have outlined a process that helps me
catch trends earlier within earning
seasons
um opposed to hindsight after it’s
already done and
currently it’s being developed into a
bigger idea that i’ll mention later
so the variables for the er specifically
for screening
i’m taking a very close look at the
implied beat of the earnings
how the ranges are created and after
hours of pre-market what is its atr gap
up where is it on its daily weekly chart
and on the fundamental side
um we’re looking at eps and sales growth
uh those beats um and
if it’s like a social media company that
tends to have other key metrics like
daily active users that’s important as
well and then another form of
confirmation that there will be active
participants
in that name is pt upgrades from major
banks and institutions
and so moving on to open variables
because within the first five to ten
minutes the variables and the
information that you have to wait
is very different from screening for the
setup itself and so within the first 10
minutes we’re asking
um what is its daily average volume and
how much of that have we done
what is its pre-gap atr um with that
pre-gap atr
we use we mark it minutes before the
open
based on where we’re about to open free
market three atr’s higher one atr lower
and the reason behind this is we’ll talk
through scenarios and expectations
five minutes before we open that way
within the first 30 minutes the morning
session we’re not doing any calculations
at all
right we just got to sit there and
monitor data and get to our decision
making process
and along those lines um
i’ve lined up some important questions
that within that morning session you
should be asking yourself if you want to
get involved in this trade if you
already are involved
in already involved with this trade um
and those questions are how fast did
price get over pre-market high
how are poland’s bought how does high
day react are there sellers present are
we stuffing
or are we holding compressing highs
versus skipping higher
how does price hold each of those atr’s
and how is volume relative to the first
leg higher which is usually the opening
bid
i mean i i understand why you’re looking
at atr but i think a lot of traders and
your traders are watching this
um are probably you know could be
wondering why do you place so much
importance
on atr and why is it such a big variable
part of your strategy
so you know what why would you say
uh you know atr being a part of your
strategy so important as opposed to
looking at something else to
perhaps um categorize certain moves
yeah that’s that’s a really good point
um so atr
is uh one of it’s the key metric we use
to track these ers when we were
just going through and tracking a lot of
data points and average true range is
what atr stands for and that’s just
going to be
within x number of days this is like
let’s say
ups had a uh ups the earnings i’m going
to talk about later had a
average range of 3.3 so on any day it
could move up to 3.3 points
uh intraday and so we would use that
number as
let’s see how many of those average true
ranges it can do uh considering that
you know has hazard earnings a lot of
volume a lot of participants um
and we came by those numbers after doing
this research right here
this these earnings about the 23 or 24
innings that are in here
are pretty much all from end of 2020
season um that that earning season was
really really
good um and on average just to go
through these stats real quick and
just so you can see what we’re looking
at or what we’re thinking about when
this trade came to be
on average these earnings will gap up
just over five atr’s
they’ll have an implied beat of 1.6
intraday
you’ll get a four atr move on average
low day from the open is within half an
atr
uh from the open and high of day is over
three and a half atr’s away from the
open
and then after going through a few
seasons we also found more edge
uh besides the day one trades like in
continuation trades
so we ended up creating uh data stack
tracking what percentage of day one
moves
do these continuation day two moves do
and we found on average
you’ll get about a 90 move of day one in
terms of measured moves
we’re usually looking for 50 of the
first move but this told us
you can be more aggressive with a
portion or a partial
um of the trade i think it’s very good
that you’re looking at
you know multiple day possibilities
because
you know if something has a large
implied move or it
typically just has a fairly
big atr it also means that you know it
comes at opportunity costs so it’s
something that
that moves a lot each day probably has
less liquidity which means you can take
less size you can control your risk
um you know not as well or something
with higher
daily average volume so the fact that
you’re looking for swing trades um
is very good because you know you can
maybe take
if you just swing trades wider stops but
smaller size but give it room to really
play out
as a trade versus just you know
sculpting
right exactly that’s that’s the way
we’re looking forward for this
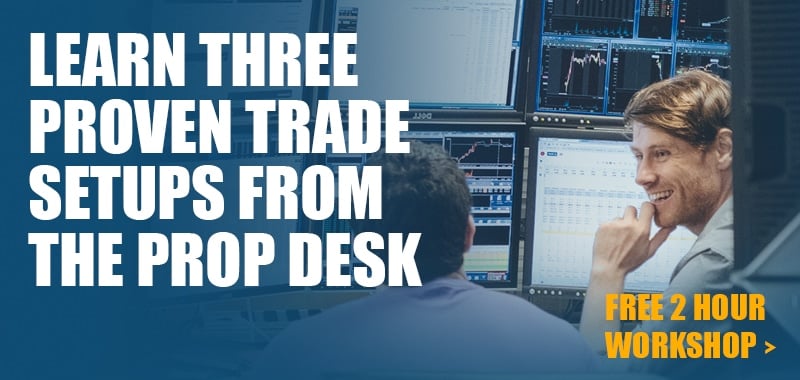
if you want to learn three more real
world setups that our traders use
including the simple setup that we teach
all of our new traders and the setup
that turned one of our traders into a
seven
figure big money earner check out the
free webinar that we’re currently
running
just go ahead and click the link that
should be appearing now
at the top right hand corner of your
screen that will open up the free
registration page in a new window so
don’t worry
you won’t lose this video you can also
visit
tradingworkshop.com to register for this
free intensive workshop
you’re going to learn more in a couple
of hours from this trading workshop
than from years of online education yeah
so just to jump into an example of what
we’re looking at recently a couple
months ago
we had upst massive implied b uh
and something that i want to highlight
for pre-market a lot of these implied
beats that have over 2x
will get run up during pre-market
meaning like it’ll open up here
or after i was like it run up all the
way up here and this one just didn’t
have that
and it did its daily average volume in
the first 15 minutes
and it never really sold off after that
move it just held highs made a new high
like 10 minutes later uh and this one
ended up doubling in three sessions
ended up going from like 80 to 160.
um i’m just gonna highlight two from
last season
from the stats that i just gave you um
just want to highlight those variables
and those questions that i mentioned
earlier like how much of its daily vlog
average daily vlogging will be done in
this case zscaler end of december
we did half our daily average volume two
minutes and within five minutes
we were holding one atr higher and
making new highs with high volume
i ended up doing three and a half atr
that day and then this pinterest trade
is the trade that
ryan and i did a playbook on um
for this earnings trade the same
earnings trade last october
um and this is just very simple one atr
and pre-market high coincided and so
within five minutes
we were over that and holding and that
was a form of confirmation for us to put
on a little more size in the short term
um and like you mentioned at this point
we were
in october end of 2020 we were just
looking at day one moves
it took us a few seasons to kind of
figure out we can expand on this a
little bit
and that’s what i’m going to talk about
here
first of all shout out joe freya real
quick he’s the one that
kind of showed us notion to track this
stuff before we were just using
uh a slide deck but you also just want
to
point out quickly uh the importance of
like like you you pointed out
uh pre-market of our levels um used
you know for for an opening drive play
for example
um very important to just keep keep
track of those levels
right right definitely definitely um
so this is uh to track
more than just track it’s to sort and
study because before we were tracking
this
uh tracking the chart books and kind of
labeling notes
in google slides but i’m sure most you
guys know you can’t
sort and study those um or filter those
down
and so notion allows us to
filter by any of these variables that we
put into uh these
little descriptions i’ve got it sorted
by implied move and all these earnings
are from this past season so we’ve got
almost 20 pretty pretty decent ers in
terms of reactions
and within each of each one of these
we’re just tracking implied move
average or the atr gap intraday move
average daily range
uh this is just a stock characteristic
we use um similar to atr but
uh we use it to choose how we’re gonna
execute a name
average volume uh what its float is how
many days does it make a new high
intraday setup and this right here is
kind of this is what told us
or showed us earlier than any other
season
that things were continuing um because
when you track it like this
and you’re inputting data into each of
these ers that come through
it’s very clear when things are
continuing and things are working
because you’re tracking the data
day-to-day
and so just to quickly highlight what
happened with ups’s earnings we got to
beat on eps
got a small beat in revenue and another
form of that confirmation
is 10 over 10 price target raises in the
following two sessions
that’s unheard of for these earnings
honestly like that doesn’t that just
doesn’t happen
um average volume 3.2 million
atr is 3.3 pre-gap those are just the
two characteristics that i’ll be paying
the most attention to
when i actually take this trade so on
the weekly you can see we’re dropping
out of a decent range
intraday on the 27th of april opening
five minutes
we did 30 of our average daily volume
and we were also doing one atr higher
and we
got over market high and so those are
the same variables that i had mentioned
earlier that
those are like if you get those
variables it’s not confirmation in
itself
but it is very very strong um if you’re
watching tape and everything
just all that comes together to those
are moments where you can get big
and the day two move uh created a tight
range under this 196
about a point and uh you were able to
get about
four or five points intraday uh but
obviously this this went much much
farther than that
this made a high for seven sessions in a
row um
so i’ll go through tape real fast just
to highlight that moment where you can
get really big we open
um and by the way nicey tick means that
you’re waiting for
nice like uh nicey like volume to come
in like to open we did 15k
like we’ve already opened 30 seconds ago
and we’ve done 15k
um that’s just it we haven’t really
opened yet is what it’s telling you
you’re gonna get like hundreds of
thousands
of shares sling through when we really
get um our nicey take
and so here i’m just watching spread
before we get that volume
i’m going to see if that’s going to
tighten up a ton and the scenarios we’re
watching here
by the way are it’s either going to have
the most aggressive scenario of pull
into 190 hold
and just go it gets right over market
high it’s going to go into this
2atr pretty fast or our most our
favorite aggressive scenario is pulling
to s1
it’s 187. um usually that happens on
lighter selling uh like an opening two
minute cell
down there and then you’ll see on tape
selling trickle down but
in this case um we got that most
aggressive scenario
after a little fake out so we saw 190
come back down in the offer here still
about 15k done
so i’m waiting we’re waiting um and i
see us start to lift
at that point i was just kind of
interested to put on a feeler
and then i saw the 200k come in um and i
was like all right so now we’re doing
volume
now how are we going to hold up 190. and
they sold it and so i took off the
feeler i was like now my expectation
having done 250k
plus shares to the downside on the bid
is 190 189.70 should drop
and they should come into 187 187 and a
half where we can start buying
they just started soaking it there’s a
hidden buyer here and so you’re going to
see me get kind of excited here with my
mouse
i’m like hey that should have sold and
so i’m just like that’s really
interesting that’s really interesting
we could turn back the other way i put
on the feeler back and i’m like all
right if they start buying this new
highs and more volume comes in
like this is going to go and so i double
up there
and i really think at that point i
should be even bigger but this is the
first
er of the season that ended up working
like this so i’m not going to get
too hindsight bias in this but at this
point i shouldn’t see it come back under
190 and hold
and um i’m watching that 192 and a half
and for that pre-market high how fast we
get over it and
i’m also watching our daily average
volume is 3.3 million
and we’ve done a million shares in the
first two minutes and
we saw the opening move was about 250k
shares lower
but within less than two minutes they’ve
overrun those sell orders and put in
another
500k plus to the upside
just a big moment of momentum and what i
realized here
is i want to be risking like i like this
idea so much i want to be risking a good
amount to view up
but i was too heavy to risk everything
um under a wick low meaning you could
whip whip me out
for no real reason and i could still be
right um so when it drops 191 here
i take off a third of it just thinking
um if it is going to get over that
pre-market high
and get momentum meaning make new highs
consecutively
in this opening drive it’s going to make
a new high on this candle
but what i’m realizing here is this
moment where it pulls into 191 um
that’s an rr moment right i got the
volume confirmation i got
uh the move higher i was watching the
opening bid i got a feeler on
that’s a good point to be putting on uh
risk reward risk where
you’re only risking about 50 to 70 cents
on that lot
but when i take the ad a little bit
higher obviously i’m risking
a minimum of a point
and so um let’s see if we can move
forward here a bit
to where i got risk off
we see it just kind of slowly moving the
other thing about this name ups about to
mention is the low adr name
this is the stock characters we
mentioned earlier um sub three to four
percent adrs
we don’t see have a ton of momentum and
so that was something we talked about
real time
so i took off about 30 or 40 percent
into
the pre-market high and at this point i
was just like
i’m in such a good position from this
like this point against the low i can
add if we get a nice range
um and so i just sat from this point
and then a few minutes later we start
expanding
like about a minute and a half later uh
into a one atr
and i end up getting flat into 196.
uh i think that’s two atr’s and it feels
extended when
you’re when you’re trading a name that
you’ve bought from the open that’s up
two three even four atrs but i’ll
highlight later why
or where these trades can go like you
mentioned earlier there’s there’s a lot
more potential here
um but yeah the short term edge we
developed was just in the day one moves
but we’re moving a little bit past that
now
so like i mentioned ups did
or made a new high for seven sessions in
a row that that’s not something that i
would look to repeat or expect in
another
earnings but that is something that was
just
wildly interesting to us first of all
ups isn’t a name that gets a ton of
momentum
it’s been unarranged pretty much all
year
for it to gap out of its multi-uh
multi-month and like out of that yearly
weekly range
and continue making new highs every day
that caught our attention
i mean that’s something that often
happens when a stock uh you know
when a large cap is in a range for an
extended period of time
once it gets out of its range you have
to remember a lot of funds and
institutions that start purchasing
they don’t purchase shares in one day uh
you know they’ll team up
over a period of five six days um and so
that’s often why you get continuation
and
it’s something i’ve seen uh you know the
last
five six years is this happens
uh more often than you’d think uh those
patterns
um and then something something else is
i mean
the trade and the tape it’s it’s it’s
definitely good and and you spotted
uh good trends in in real time um very
quick short-term
trends on the tap um and the executions
were great
um i agree you know would have it would
have gone from being a good trade to a
great trade if the stock were to base
above v1 for five minutes and then
you’re able to actually put on some
meaningful size
against uh you know the low of that
consolidation
where you’d be wrong for example um
but uh yeah the fact that it went five
six minutes or however long uh
10 minutes straight up into two atr’s
uh that that made things tricky i i
would have taken um
i would have taken you know if not all
of it maybe
60 70 off as well into that up move
that’s definitely the responsible thing
to do and then how to pull back made a
higher low
um and you know you’re very confident
about the position
and your plan and it was playing out
according to that plan and that would
have been
you know another really good setup to
buy the higher load once it pulled in to
get that rescored
but but that was good that was yeah you
saw you saw some good stuff there
right right thanks um and like you
mentioned
these trades like they will uh work and
go for multiple days
but what we saw was there’s no get like
when we tracked
this trade and made this our main
playbook trade we found that
uh it’s a lot easier to be wrong in this
trade
than to be right so then monitoring each
season was super important to us because
we got a lot of fake outs where earnings
um
they would have a day one move and they
would have no continuation at all
um or the earnings would have it would
look like it would better have a day one
move make a really strong move off the
open
and it would go to a lesser extent
intraday and so that’s where we realize
we have to be adjusting our execution
styles
but when we found this this to be in
play like this earnings trade to be
actually bought by the general market it
would play out with stuff like this
where we get a catalyst or
we get a single name that makes us look
back at these earnings and say
okay this could be a trade that actually
plays out this season
whereas like the beginning of 2021 that
earnings season we got caught up in a
little bit
took a little bit heavier losses than we
needed to just because we got a couple
that worked
and just kind of assumed that you know
the rest of them would work
pretty well even though we didn’t get
kind of a confirmation or a wild
reaction like ups that made us like
look back and say this is a change from
expectations
um and so
along like along those lines we were
just thinking after we saw that report
and that reaction
we knew that most of the s p is
reporting in the coming weeks and so
that just told us
we need to prioritize our er setups if
we’re going to get volume confirmation
we’re going to get those
other variables in play we just need to
be there like prepared to meet that
opportunity
and so when we studied back after seeing
eps we just looked back at those
previous ers
that had already taken place in the
season and we did find a couple trends
uh first one being gap ups at a big
basis were being bought like
like you mentioned they usually go for
multiple days but we also saw seasons
where
gaps out of big bases are immediately
sold and so we weren’t just going to be
immediately buying all gap ups we just
knew we had to be
screening filtering and watching those
important moments
and yeah the other trend was they’re
continuing they’re going multiple days
so i’m gonna go into a few examples of
how we use
the trend data to come up with more
trades with edge because
like you mentioned like this day one
move it’s a it’s a good trade like it’s
not
it’s a good trade but there’s so much
more edge along like this idea
and that trade specifically that we just
that’s just untapped for us right now
um so you know after we saw that
this is on may 5th first week of may
we saw bgfv gap out of a multi-year
range
and you know this top end being about
20. ended up going 50 percent two
sessions and holding 30 for a few more
um an intraday this is what it looks
like did 30 of our average daily volume
in the first two minutes and that’s just
the sharp projection from 20
that we got here and then within
that opening move we were one atr higher
and holding view up
and if we look at the day two move and
we talk about that measured move that i
mentioned earlier
we were holding a range of a point on
this opening base and so that’s
just like that’s a tight range for this
after a move like this
um and rr wise even a 90 measure move
would get you about four to one rr
you end up getting five plus just
because of the way the state traded
oh i must say that first child where you
know it opened up
uh let’s let me see if i can someone
make this bigger and zoom in when it
opened up at like 20
i guess 21 50ish and it’ll work down to
20
looks like 2020 2023 yeah um
and then that immediate snapback and
reversal that that that right there is
that that’s an a plus set up i mean
that’s a stuff for whether it’s the long
side or
or downside but that’s a fantastic setup
but when i see something like that
if i’m you know biased on the long side
in this case
um and i see that happen off the open
i’ll be i’ll be big size um
into that reversal and if it’s you know
if you flip the chart upside down and
you get
that stuff and then you know to the
downside um
i’ll i’ll be yeah that’s an a plus set
up for me it’s just it’s great and it
came right into support rejected trap
shorts
got longs to shake out from pre-market
and then you know off to the races on
the reversal so that’s a very good setup
to uh to playbook in itself
right yeah definitely the one thing i’d
ask uh i was just trying to think about
this specifically is how do i measure
your risk here because when i saw this i
liked it a lot obviously
but this is such a wide move compared to
its acr
i i didn’t want to risk the wick low and
so i was a lot smaller than i could have
been i think
because i don’t think that this low
should even be retested at this point
for something like that it shouldn’t
even it shouldn’t get below 2050
um and so in theory you want to be
pretty quick and once it gets to
over 21 it’s it’s a it’s a that’s a like
that’s a fantastic buy spot so
i would i would be buying a bunch of 21
and i’d have my
i’d have a mental stop at 20 50-ish um
you know depending on how it acted down
there so i’d risk 50 cents and
and uh you know that’s yeah that’s
that’s a small amount to be risking
based on your pre-market range based on
the move it just made off the open so
you know you’re in for
for a nice trend um and and some nice
kind of outsized moves
right right okay i like that i’ll look
back at that
and try that but i mean look i’m more
the way i you know the way i trade is
more
sort of feel and intuition and whatnot
it’s not it’s not so systematic i mean i
have my system and that’s all i stick to
um but within that it’s um i don’t i
i i don’t incorporate too many um you
know
methodologies and whatnot yeah so that
was the
bgfe that happened on may 5th this is
sally beauty holdings retail name
may 6th gapping at a multi-year range
gappy at a multi-month range as well on
the daily
and intraday opening right at this
pre-market high
it just took off immediately so this was
a pretty easy opening bid
got good volume two atrs in i think 10
minutes
so i was flat into that um
and day two opening bid healthy one atr
move
uh from the opening drive very simple
continuation trade there
avid is a lower volume name uh we saw we
saw a few lower volume names like three
or four
really good reactions from names that
acted similarly to this so i wanted to
highlight how this
actually goes um the setup looks really
similar on the daily but
intraday you’ve got to be expecting
something different um
it’s got a much tighter atr and to open
its atr or its spread was a point
with just over a point pre-gap atr
that’s a problem cut you off there
um do you want to will you go back uh i
think it’s like two slides
yeah so sally beauty holdings oh yeah
one more
so so yeah that one uh one uh go one
more ahead
the the day one day two child yeah so
that’s i mean
you know related to this as well but but
mostly with low floats um
and this is a an amazing setup for a
potential squeeze you have a low flow
gap
gaps up on day one same child as svh you
know
goes up comes off close below v while uh
relatively weak or perceived to
be a weak close the next day the stock
holds above
the previous day’s high the whole day so
longs are trapped
uh uh shorts are trapped you know longs
are in the money
um and that’s often where you’ll see a
really nice after-hours squeeze and
and potential madness the following day
so that’s a really nice setup
in this case too you know for a medium
large cap it could be
um you know i don’t know what happened
on day three but they might
it looks like the setup is there for
continuation on day three but with the
low float this is
for the long side a plus
sorry to cut you off yeah that makes
sense yeah i don’t
count as like uh for the large caps i
don’t see
the shorts as position but i’m sure that
was definitely a variable for that one
um avid the lower volume name like i
mentioned
less than 500k volume so we’re
classifying lower volume
it did 20 percent of its averages in two
minutes but it’s atr
it’s spread was almost it’s full atr
pre-gap and so that was
uh just something that made it a little
bit more difficult to put on size in
this one but
uh it quickly did an atr and
like opening minutes and held higher and
then day two held higher again
um and first we got pull held and
made a new high very simple continuation
trades
and so like you mentioned um
making this into a bigger trade seeing
that there’s a lot more to
get involved with here just to highlight
the goals not to catch highs or lows
but what i’m realizing is when we do
manage our risk in the best case
scenarios those best case scenarios end
up being
super important inflections that i think
multi-week multi-month trades can start
from there
um and like i said earlier like it’s so
easy intraday to say oh this is super
extended i should just dump it here
and i think like like you said it’s it’s
responsible to be
dumping most into like those atr targets
like
uh at least 75 percent i think because i
think most of our edge is just beyond
that is in the day one
and we’re still creating the rest of
this trade um that’s going to be a
bigger trade
but right now uh i’ll just show some
instances where
it’s kind of clear that uh not clear but
it’s clear that it’s
i’ll just show you the trick yeah i mean
in the future like uh
whatever size you’re using for a trade
that you really you know in the morning
before the market opens you
you’re just super confident and excited
for this trade and you know your guts
telling you there’s really could be a
nice one a juicy one um whatever size
you’d usually take just put on an extra
25
and then you know that 25 isn’t the day
trade that’s the
you know if this works that’s gonna be
the position i hold for two or three
days sort of a thing
um and then trade so say you have 100
shares you know put on 125 shares
trade 100 shares as the day trade as you
know
your system tells you to and then the 25
shares is there for
you know the potential for it to turn
into a swing and then you have a nice
core position
if the stock closes strong you know add
another 25 shares
take 50 shares overnight um sort of a
thing
but you know bigger picture doesn’t yeah
it doesn’t doesn’t make much of a
difference whatever
extra 25 you put on so you might as well
do it and start playing around with um
you know the swing trading idea right
right yeah much more
comfortable in those continuation moves
like day two day three now
so i definitely see how that could play
out well with my system
um for the for these specifically we’re
looking more
like much much higher timeframe so with
this one
um i was buying this day one move with
about a 165 average
risking two points to the low and i’m
not thinking that this is going to
create this range right and
you know have a measure move twice
higher go to 230.
i’m at this point like intraday i was
only looking at this
intraday move like i could get my
targets were like into 180 and i was
like all right that’s it
but after looking back at some of these
charts from these earnings that we
traded
in the last earnings season where this
setup outperformed
um and told us hey this is in play there
were some really really
good inflections so i’m thinking of
trailing five or ten percent
um to the 10 moving average in the daily
and that’s just an entirely different
swing trade than the momentum trade that
you mentioned but
i’m more confident in the momentum trade
this one is going to be more of like
let’s see how it bases and holds like a
range higher
um like it did here and so this was z
scalar like i had mentioned
from december of 2020 earlier you guys
saw the intraday reaction
upwork from um
i think it was november yeah november of
last year i was buying this 27
i don’t know where the error is off
buying this 27 um average here
i stopped out um i actually stopped i
got stopped out a few days later i was
i ended up swinging 30 of this because i
ended up really liking this earnings
um and i felt like this could go but see
like
if they don’t have the instances and i
don’t have all my expectations and
scenarios set in front of me for how i
should take the swing trade
this is gonna like this is just gonna
happen i’m gonna get stopped out of the
lows pretty much every time
um but i think next time trailing this
uh to the 10 day
on a much smaller portion and having a
larger portion for day two day three
it’s the best way for me to try it out
yeah and also
you know with screen time you’ll get
better at that because you’ll know where
the stock could go if you are right
and then you’ll place your stop a little
bit different on these swing trades
we’ll give it some more room because it
works
you know again it just comes with screen
time and experience you’ll
you’ll you’ll see things play out and
your trades play out
a lot a lot bigger and a lot better than
you thought so
naturally that will take care of itself
i think do you have any other
uh suggestions of while we’re on that
topic of
besides screen time studying more behind
that screen time getting more
reps with those learning experiences to
just
get more from the screen time with the
earning earnings experience well
so you know i didn’t do i i don’t trade
um
really earnings i’ll trade like price
action momentum but i don’t trade it
um with um too much excitement
but with low floats what i did
was like six months in one year in
um i just started making lists of
uh from speaking to people of like the
top 10
20 low flow trades of the past three
four years um and then i just studied
all of those
so um you know there’s so many people at
the firm that
um trade large caps and earnings
um and you know
all you have to do is ask them to go on
their info center or trader view and
you know give you a list of like their
top 15 or 20
earnings trades from last year and then
you can go and look at those
because it’s impossible to find that out
on yourself by yourself you know they’re
just
there’s way too many 7 000 stocks that
report earnings every
three months so it’s hard to so you want
to just find out from a trader the top
15 20 movers um that they had last year
and find that off from five traders
that’s 100
um different trades for example and then
and then you can go through all of those
and and and you know playbook those
charts uh
create a book of charts and and get some
screen time that’s what i did with low
float and it helped so much
um it definitely sped up the process
right right because history repeats
itself
mm-hmm definitely yeah this is just
stitch fix
really solid er this is one of the ones
that i studied a little closer because
this doesn’t happen often
where it makes this kind of move but uh
last one
was top uh pretty simple i’m risking
just over a point
and 10 moving average daily stopped me
at about 30 about three or four points
higher um
that’s all i had for this presentation
but that’s just generally how we’re
looking to make it a swing trade
um and a higher like higher time frame
improving that
past the day one and past continuation
trades um that’s more speculative still
still going to try that out
oh it’s fantastic i think it’s great
yeah you guys you guys are doing a
really good job and i think it’s
it’s awesome that um that sheet that
you’re using
uh it’s kind of filtered through your
your charts and setups it’s
it’s fantastic it’s really really good
yeah well done
thank you thank you yeah i was really
good then this is a strategy that you
can scale up over time
um you know with options as well so it’s
it’s
if you find that there’s consistency in
edge um
over time you can really put your foot
on the gas with this and
the sky’s the limit hey go ahead and
click our subscribe button so you don’t
miss
any of the videos they’re producing for
you and the trading community and please
take the time to add your feedback in
the comment section for what videos
you’d like for us to produce next
and what you found helpful from this
video from all of us at smb
train and trade well
* no relevant positions