I am co-writing this blog with one of my trainee trades who sits beside me on the desk. A little backstory is appropriate. Earlier in the week, one of my other trainees got in involved in a trade that I can only kindly describe as “dumb”, and she blindly followed him into it. Together, they had successfully identified the highest ranked In Play stock on the SMB radar, which also happened to be the strongest stock in the strongest sector in a strong market. Then they proceeded to get short because they “wanted to make a trade in it.” (Their words, not mine.)
We have all done this, but it’s a dangerous trade because you tie up mental capital and usually miss the correct trade because you were screwing around trying to be cute on the countertrend trade. This was a teaching opportunity that I really couldn’t let go, so I spent extra time after the close giving the two of them a (more or less) good natured public humiliation, made them send me documents explaining their (faulty) reasoning in the trade, and then reminded them both about it several times the next day. In fairness to both of these traders, I should point out that this trade was uncharacteristically stupid for both of them. They are both doing well, and we are all vulnerable to making silly decisions in the heat of battle, but it is part of the teaching process that serious errors must be addressed. In this case, the market let them off easy and they had small or no losses on the trade, which was much worse than taking a huge rip, so the responsibility of inflicting some suffering for this decision fell on me.
I spend a lot of time and energy teaching traders I train how to properly make countertrend trades. To summarize, there are three steps: 1) you have to have a legitimate reason (defined by a number of patterns we use) to even think countertrend. 2) You have to see a sharp momentum move against the previous trend, showing that whoever was in control has lost that control. A phrase I use to describe this is that the market shows “a distinct change of character”. 3) You have to find some way to get into the trade safely, again, using a handful of specific patterns I teach. Without this sequence of break of trend, signs that a new trend could be in place, and a good entry spot, there is no trade possible. After the poor trade these two made in the middle of the week that completely violated all of these principles, I was so pleased to see Mona come up with a textbook reversal trade that I have asked her to write a blog about it this morning. I will interject a few thoughts (in blue text), but here is the trade in her words:
——————————————————————————————————————————————————————-
On Friday, January 28th, I was going through the stocks in play on the SMB radar to find a setup to trade. The SPY had already come off hard off of the 130 level, and I was cautious to initiate a short position. It was a little frustrating because if you were not short before the move actually happened it was difficult to get short; regardless, I was trying to find a consolidation to get into when I came across one of my favorite setups.
Good points here. I think something she missed was the importance of the bigger picture market setup (which I had been writing about for a week in my Morning Thoughts blog and my Waverly Report. We had many reasons to expect a large break in the market, but a sense of complacency had set in at the highs. This combination can certainly lead to a much larger than expected downmove, so, in my opinion, there was more potential for extension on the shorts than most days. This is an important point, but it is hard to properly incorporate a big picture view into your daytrading.

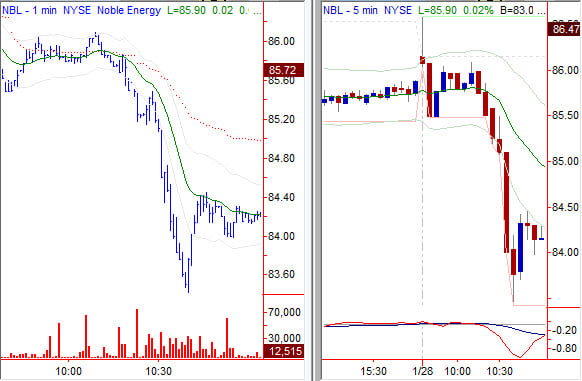
As you can see from the chart above, NBL was selling off on a lot of volume. I really like when you see the big red candle with volume followed by another candle with a big wick and a lot of volume as you do around 10:30 am. This shows a selling climax where the sellers were unable to push the stock lower, which is a bullish sign. Next you see a green candle followed by consolidation, a pattern we like to call an Anti. I like to get long in the consolidation. In this case, after it consolidated for about 20 minutes and the momentum shifted in my favor, I paid 84.35 for two lots.
Ok, so I swapped her chart out for mine, but I wanted you to see the 1 minute and 5 minute timeframes. (We do a lot of work incorporating multiple timeframe analysis in our trading.) Everything she wrote above is perfectly correct, the only point I want to add is that the parabolic blowoff is more visible on the 1 minute than the 5 minute. Note the long wick on the lowest red 5 minute candle. Note the shift of momentum to the upside, the the little anti (which is a pattern Linda Raschke wrote about probably 15 years ago). Lastly, note that this trader waited for the shortest term momentum to shift in her favor before entering the trade. Burn the chart above in your mind. THIS is how you properly trade countertrend. Brava.

Looking at the chart above, you can also see that NBL was consolidating higher while the SPY was still selling off. That’s another bullish sign that made me confident about the trade. If it traded against me my plan was to sell in the mid .20s and buy it again lower. If it traded in my favor my plan was to sell one in front of 84.50 to cover my risk and to sell the other one in front of 85. There are two reasons for this: I was looking for a measured move, and VWAP at the time was at 84.93. As the stock approached the whole number, I saw there was a seller at 84.88, so that also supported my decision to sell at 84.86.

In retrospect, NBL was very strong compared to the market. I should have held my first lot instead of selling in front of 84.50, or at lease bought it back once I realized the stock was not going down. Here is the intraday chart for NBL. Yes, it traded to 87.83, where it failed, but my play was not a trade to hold with NBL. Overall, I think it was a good trade, and I have found that this play has a high success rate.
It is always good to find patterns that you can repeat. To me, this type of pattern recognition is one of the most important thing a developing trader can work on. We do not apply these patterns in a vacuum, but even if we did, they would give us an edge and put us far ahead of the curve. Though we (myself included) sold this stock far too early, this type of major reversal is a maybe 1 out of 10 shot, and the right play is usually to take at least a large portion of your profits at a smaller target. Regardless, I’ll spend some time this weekend thinking about the two and a half points I left on the table with this trade, and I’m sure she will be doing the same. Even though so much of this trade was textbook-perfect, we will always be thinking about how we can get better.

10 Comments on “Guest Blog: Intraday reversal trade”
I guess i’m just not seeing the volume characteristics of a big change of momentum i’d like to see on the one minute. Maybe i’m missing it. But the bars going up do go up at a higher rate than the bars going down. That would imply a loss of downside and increase on upside.
And of course the rs vs spy is a big, big plus.
Though my 1 minute example has volume on it, I just put it there because she referred to it in the text. I do not use volume on any of my charts and I have not found volume to be helpful/important in chart reading in any timeframe. This is backed up by a ton of pattern testing I have done that was unable to support the conventional wisdom of the importance of volume.
This is a bit radical I know, and it’s only my opinion… but it’s backed up by a lot of quantitative testing and actual trading experience in many different timeframes. I think the importance of volume on chart patterns is dramatically overstated. To me, this is another area where the conventional wisdom of technical analysis may be wrong.
Not to take anything away from a great trade but on average would not the best move be to find a weak stock to short on a day like Friday rather than a strong stock to buy?
Hello Adam,
Great post, as always 🙂
Have you found anything this weekend on how to get back on this trade ? For my part, I think that the break above the VWAP + the failed test after 12:00 was an indication the stock would not go back down. But that’s in hindsight, I have no idea what the price action looked like and I’m not a good counter-trader :p
andrew,
no doubt. you are absolutely correct. there are a number of reasons why this trade was a good trade, but i was definitely focusing on shorts. in fact, i bought this trade for less than my normal size because it was so countertrend to the day’s trend.
there were several places to get back in, but we have shown you a 1/20 example. most of the time, these countertrend trades are smallish (but usually pretty easy) wins before the higher timeframe rolls over and the trend reasserts itself. usually, you will lose money trying to get back in these so i’m not too upset that we left so much money on the table.
Thanks for the reply !
I agree that most of the time, after such a break down, the market might test the VWAP and then the downtrend will resume. But my point was rather “what if the market breaks above the VWAP ?” Thaht might say a lot about the bulls taking the upper hand here, especially when the general market conditions are bearish.
Just a thought anyway ; as said above, I’m not a great countertrend trader.
Great posting!!!
Awesome post, I am an avid reader of your blog, keep on writing these great posts, and I’ll be a regular visitor for a very long time.
Nifty option Tips
Awesome Information With Chart.
It Such A Great Combination Between Figures, Diagram & Information.