(Parts 1 and 2 of this post are located here and here. Please read them first.)
To summarize, we left part 2 with an interesting finding. It appears the market gaps on the open very frequently (26.3% in that sample), and that there is a tremendous edge for those gaps to close. Specifically, we found that 75.8% of those gaps traded back at least to the previous day’s range.
There is another important concept to consider. We have almost certainly found something that is statistically significant, meaning that it is a real element of market behavior, but does it matter? There are many market tendencies that are statistically significant but not economically significant, meaning that, for any number of reasons, these edges can not be exploited in the marketplace. A prime reason for this divergence is often that the edge is so small it is untradeable. In extreme cases, for instance in very illquid stocks, price changes may simply be the difference between the stock trading on the bid and the offer, so any “edge” we find is absolutely unexploitable. (This problem plagues much of the research on small cap stocks by the way.)
We probably avoided many of these issues by using actively traded stocks, but we should still be concerned that the average gap in our sample of stocks was only 0.78 basis points. This is less than a penny on a $50 stock, so even with perfect execution, we are going to have some issues…. or are we?
Here is where we start to touch on some of the art and discretion in this kind of analysis. In this case, it is obvious that we should look at the stats for up and down gaps separately, as they are probably canceling each other out in the average, but as a general rule we should be suspicious of taking too many cuts through the data. The more ways you slice and dice a dataset, the more likely you are to run into problems. (What about gaps on different days of the week? What about different price level stocks? Do gaps behave differently in different sectors? How about NYSE vs NASDAQ stocks? How about tickers that begin with with different letters of the alphabet?) In fact, tickers that begin with the letter “D” close the gap an astonishing 82% of the time! Wow. What should we do with this information?
Hopefully, you realized the answer is clearly “nothing” in this absurd example, but this illustrates a very real danger. If you torture a dataset long enough, it will confess to anything. Many of the things you read in books or on websites about market behavior comes as a result of these kinds of mistakes. (Note to the academically inclined: Learn all that you can about data-mining bias.)
How do you avoid this? No perfect answer, but a good place to start is to think before you just start doing analysis. Do not try 100 different things, and stop when you stumble onto something that looks interesting. Do some basic exploratory analysis (as we did in part 2 of this series), and then think. Make sure that your ideas make sense and manipulate the data as few times as possible. I have gone overboard on this to illustrate a point, but, in this case, we are safe looking at the statistics for up and down gaps separately.

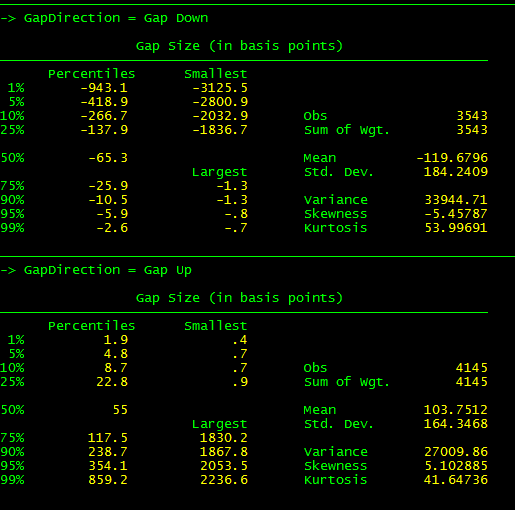
Summary stats for up and down gaps, separately
The average gap up is 1.03% and average gap down is -1.12%. The medians are .55% and -.65%, respectively, which should suggest that our means are being “pulled” by outliers. The rough symmetry is good–when we look at a market idea and find it performs wildly differently for buys and sells, it is time to be very careful and a little suspicious. Not surprisingly, there are some very large gaps in the sample, so it may make sense to look at large gaps separately. For instance, gaps over 5% close less than 30% of the time. Perhaps if we were in the business of fading gaps, it might make sense to not fade very large gaps?
There could be something else at work here. It would be extremely unusual, say for AAPL to gap up .01 on the open and not touch the previous day’s high, just as a function of the random fluctuations. Some of our small gaps are undoubtedly closing due to that random noise, and we also are not very interested in trading extremely small gaps because of transactions costs. Can we cut these out? What is a reasonable threshold? Again, no firm answers, but I can live with a floor of 20bp, which means I would trade no gap smaller than $0.10 on a $50 stock. If we were to restrict ourselves to trading only gaps greater than 20bp and less than 5%, we would have 5822 trades, and still have a 72% win ratio. Though there are many, many more questions we could ask, I think it’s clear that we are onto something. If you want to summarize the 3,500+ words on these last 3 posts to something you can put on a Post-It, here it is: Opening gaps tend to fail.
This is a fundamental principle of price behavior that every trader should know. What is your first inclination when you come in and see a stock up 3% in the premarket? Many people start looking for someplace to get long, but be aware that this is in clear contradiction of a very strong statistical tendency–the best trade is usually to fade the gap. (The gap fade is actually one expression of mean reversion.) We obviously can dig into this much deeper, looking at the interaction of news events with price action, the market structure preceding the gap, the number of stocks gapping on the same day, premarket volume, etc etc, but I think we’ve accomplished what I had hoped to in these blog posts. Though the market tendency is important, I hope that seeing some of the thought processes and potential pitfalls in even this very simple analysis has been helpful.
Just for fun, if I’m declaring this gap closure tendency to be a more or less universal principle (in stocks, at least), maybe we should check a bigger sample?
Using the current S&P 500 (as of 10/1/10) over the past 2 years (N=125,811), we find that:
Stocks in this sample have gapped on the open 28.2% of all trading days.
20,261 of these were gaps up and 15,206 were gaps down.
The mean absolute gap was 0.69% (median .42%).
Using all gaps, we see gap closure on 76% of all gap days.
Large gaps (>5% or <-5%) close only 9.6% of the time. (N=279)
Removing gaps which are probably too small to be economically significant (smaller than 20bp (= 0.2%)) we still see gap closure on 70.0% of the time.
Hmmm… those numbers look kind of familiar… We might be on to something here…
5 Comments on “Gap Study (3/3)”
Excellent series of write ups! If you don’t already follow, I’d recommend checking out :
http://twitter.com/masterthegap
Great posts, Adam! The fading the gap trade is very common and I am wondering why it has not been arbitraged away by the bots. Sometimes I am really puzzeld how strong some tendencies are in the market like reversion to the mean and the momentum phenomenon….
Cheers,
Markus
interesting post but at least for me it confirmed what I already thought – there’s no edge trading based on this kind of gap statistics.
You mentioned some of the reasons in the post but most importantly – you can get, for example, to 80% winning rate fading certain kind of gaps and still end up losing money
Ivan,
I agree with your point that win rate doesn’t matter for much. You can certainly have a high win rate and a net losing system.
I respectfully disagree that there’s no edge here. There’s a tremendous edge here, but it has to be applied correctly.
I’ll write on both of these points in the near future.
I think it’s a case of real order flow overwhelming everthing else. Remember, the bots don’t determine market direction. The most they can do is distort in the short term, but the market is still going to go where it’s going to go.