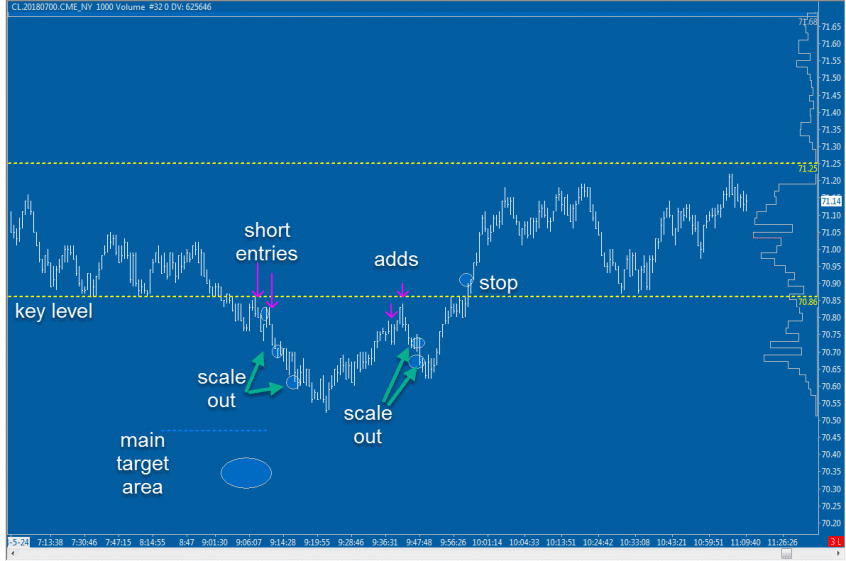
It’s time for the Futures Desk Trade of The Day! Today the trade is from yours truly. It wasn’t a monster winner, but it was a quality trade from start to finish. CL (crude oil futures) A good entry according to premarket plans and key levels Quality profit taking when given the opportunity Aggressive add given the context of the … Read More
SMB Futures TOTD – 5/23/18
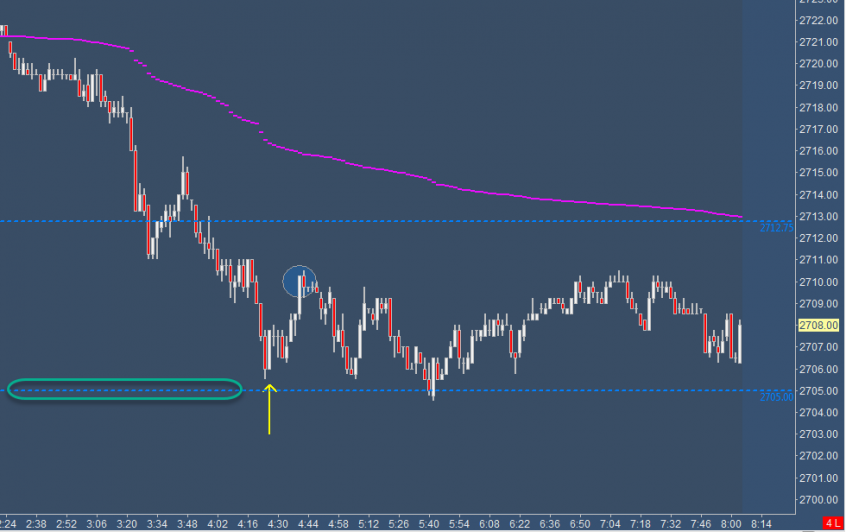
It’s time for the Futures Desk Trade of The Day! If you missed yesterday’s, you can find it here. We love having our traders in Europe and Asia on the Futures Desk. It allows us to capture some trades while the rest of us here in NYC are fast asleep. This trade was just after 4am NYC time. Key variables: … Read More
SMB Futures TOTD – 5/22/18
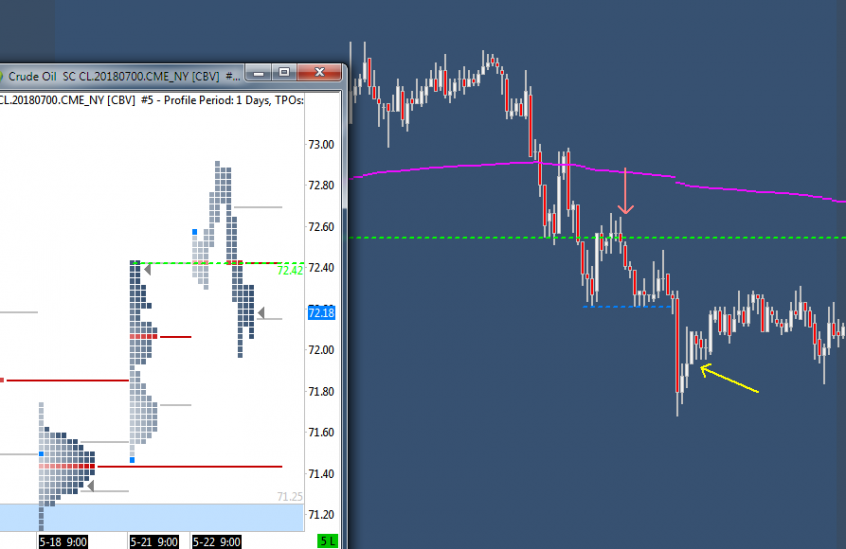
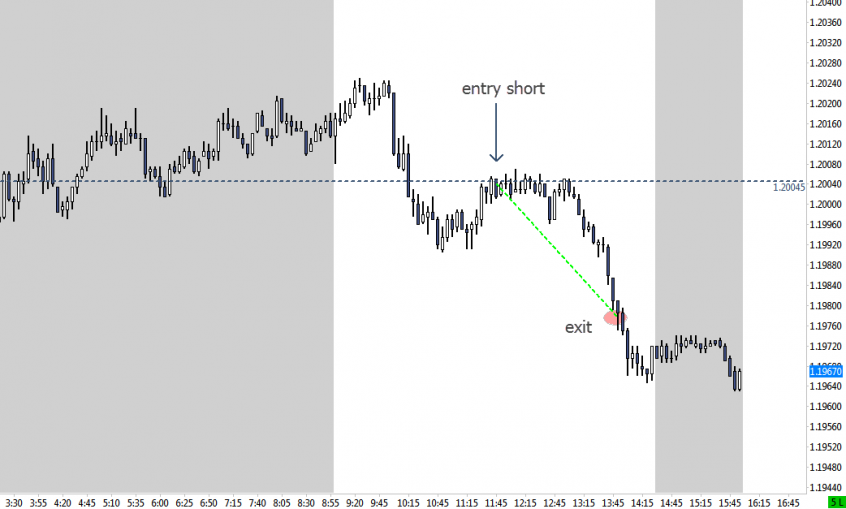
It’s time for the Futures Desk Trade of The Day! The trade was in crude oil futures. Speaking of which, many think that this is a “wild west” market, and it’s truly not. It’s a great market with solid liquidity and often great momentum. Key variables for the trade: Failed attempt at breakout outside the prior day’s range Failed attempt … Read More
SMB Futures TOTD – 5/17/18
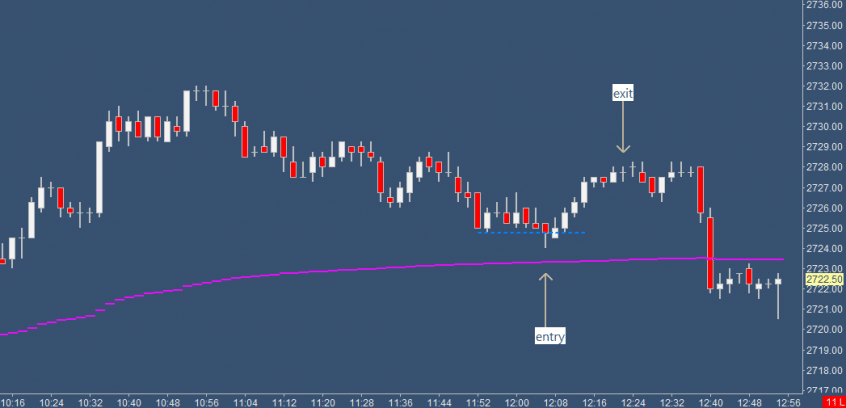
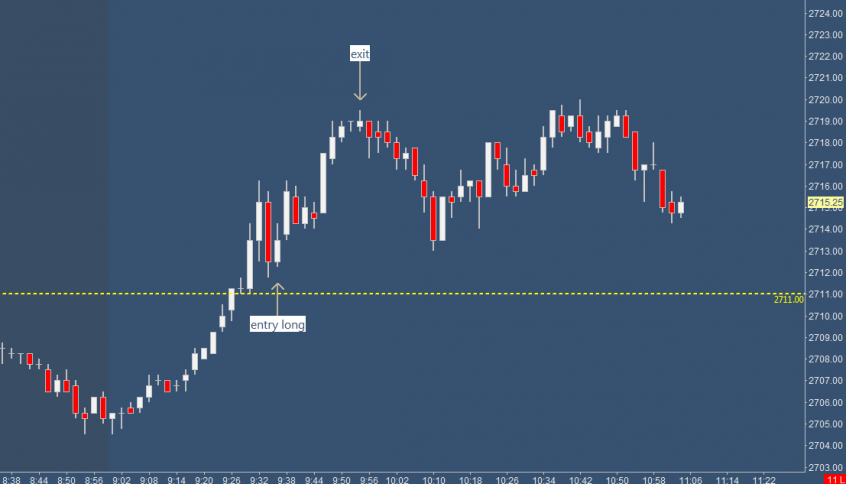
It’s time for the Futures Desk Trade of The Day! Here’s a link to yesterday’s trade as well. This trade combines a classic “spring” pattern, with the use of vwap, and time of day factors. Key variables: ES in an uptrend defined by method Pullbacks mid-day during slow trade can be more complex (multiple legs) Watch for pull back into … Read More
SMB Futures TOTD – 5/16/18
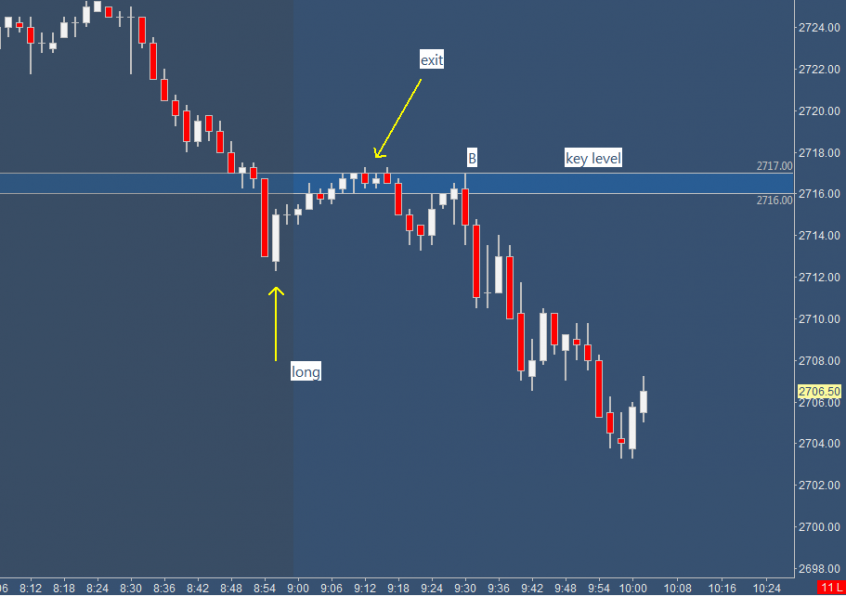
It’s time for the Futures Desk Trade of The Day! Here’s a link to yesterday’s trade as well. Today we have a trade that achieved 6 to 1 R/R – This is something that is doable on a pretty consistent basis for many traders. (Many retail traders at home think that this type of R/R is near impossible.) The trade … Read More
SMB Futures TOTD – 5/15/18
It’s time for the Futures Desk Trade of The Day! Here’s a link to yesterday’s trade as well. Today is an interesting one, and it embodies something we hold dear to our hearts. That is, “Not all wins are wins, and not all losses are losses.” In short, the simple outcome does not determine the success or failure of a trade. … Read More
SMB Futures TOTD – 5/14/18
Yes, the Trade Of The Day, the TOTD – (pronounced “toddy”) We’re going to be bringing you fresh TOTD’s each day that highlight a real trade taken by one of the traders from the new SMB Futures desk. So let’s dive into today’s TOTD. 5min chart: 6E Futures The market and key variables: Our trader was watching Euro/USD currency futures, … Read More
Not All Setups Are Created Equal
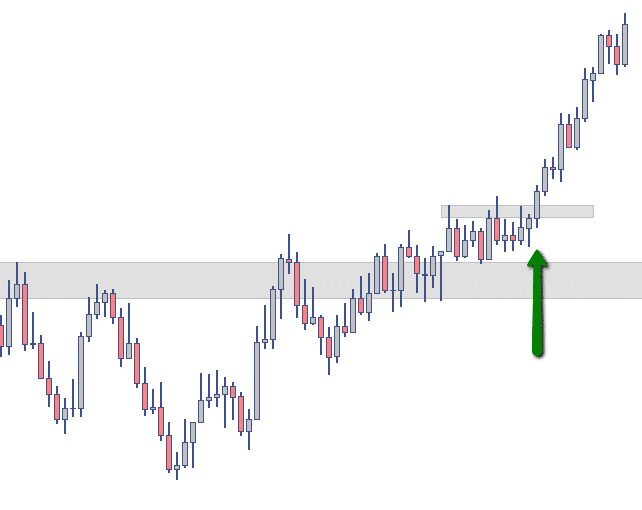
In working with retail traders I get to see where people have holes in their trading plans, and where they need the most help. One of the most common areas I see a major need for improvement is in using the higher timeframe. Why do we use the higher timeframe? Let’s say, for example, we’re in intraday trader that likes to … Read More