I have an idea for a new blog series. I will try at least once a week to post a setup based on SMB Fundamentals: Fresh news, Technicals, and the Tape. But in the interest of it being a learning experience and also a recognition that the readers of our blog are way above average intelligence, I will ask for your analysis of the setup prior to posting my thoughts on how I would trade the setup.
These setups will be second or third day plays in order to incorporate “the tape” as part of our analysis.
When contributing your analysis on how you would trade the setup you can also incorporate hypotheticals on what type of price action would get you to be more aggressive or more cautious with respect to executing your trades.
SMB Fundamentals:
- Intraday Fundamentals/Fresh News:
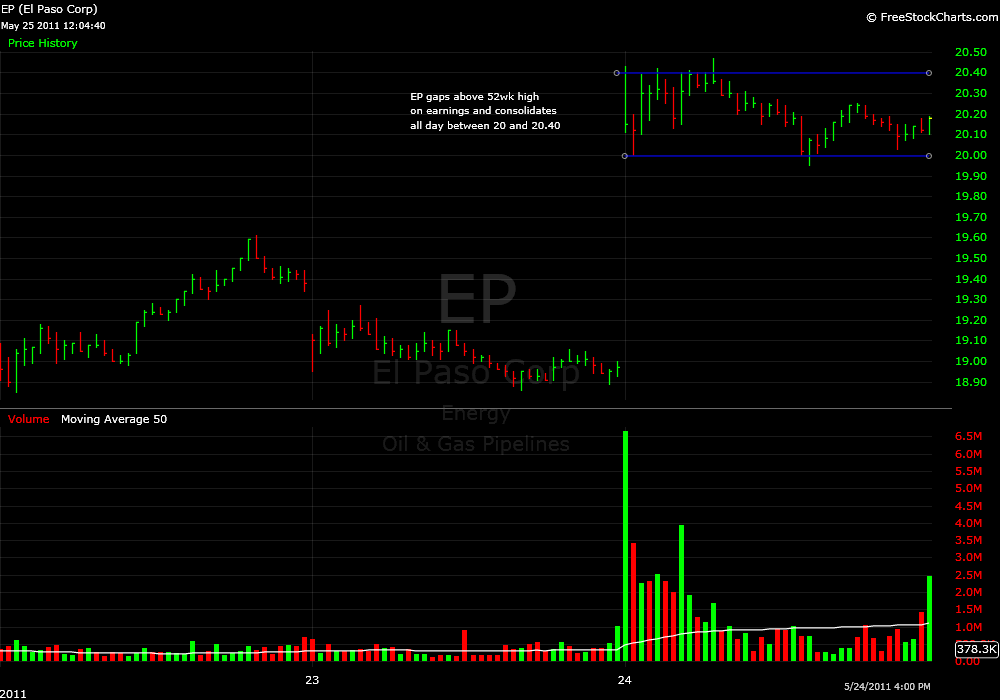
24-May-11 08:19 ET In Play Gapping up : In reaction to strong earnings/guidance: SOLR+12.7%, HSFT +6.5% (ticking higher), CISG +5.4%, PWRD +5.1%,AZO +3.0%, EP +1.4% (ticking higher) - Technicals: traded in a 40 cents range for the entire day; had a new 52wk closing high
- Tape: There was a seller the entire day at 20.40
Long Term View
Intraday View


7 Comments on “Spencer’s Setups”
In the Early morning I would trade long a bounce off the bottom of the 24th’s range as an Opening drive play, Tight Stop. And I would add to the position if it broke highs. If it traded below this range I would wait for confirmation of a lower high, then trade the position short. If EP didn’t break highs, I would look short if it came back to lows, and traded below. I would stay away from the stock if it stays in the range.
Steve,
Here’s my EP Analysis:
On the day of the breakout:
Positives:
60 min chart breakout above month long base consolidation. 60M base high (19.69) cleared easily on very high volume.
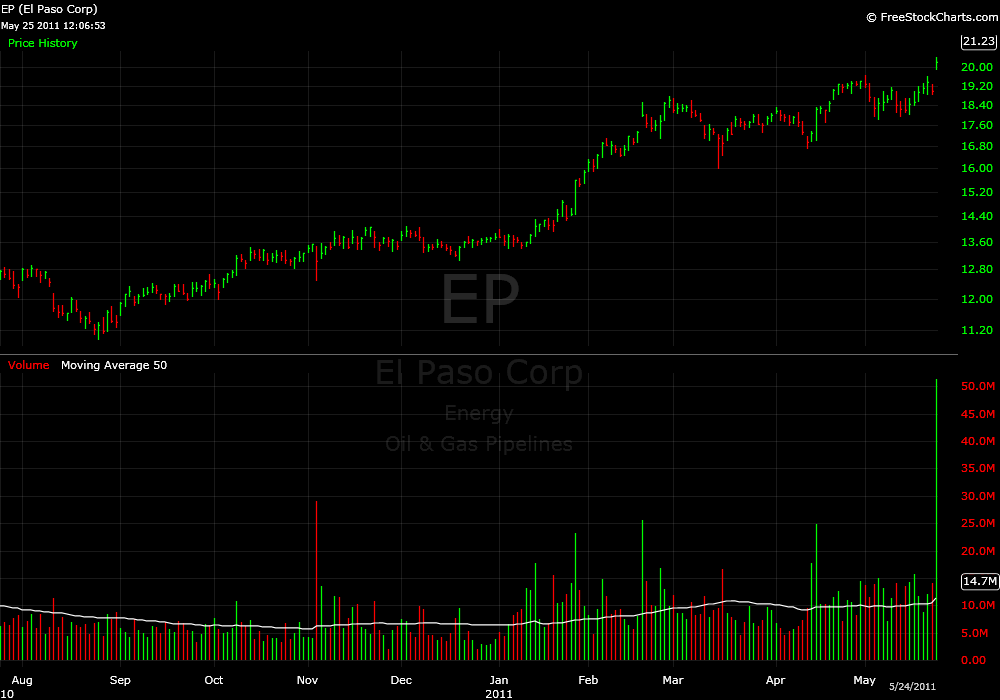
Nearest resistance is on weekly chart (21-22.50). There is a lot of room to run higher.
Negatives:
Oil Futures (CLN11) were in a sideways range and price was at resistance at the equity open (~99.60) Note 100 is a big psych level.
Note EP is a nat gas stock but using oil futures for an energy proxy here.
EP weekly and daily charts – price is extended from 20 period MA.
So strategy on the 24th is to watch price at the open and look for a pullback in EP and the oil futures to support areas and play the bounce.
Pullback areas
EP:
-Previous pivot high – 19.69
-Figure 20.00
-Let price trade and see where buyers step up and volume is done.
Oil
Support @ 98.50
Trading on the 24th.
EP-
Price retraced at the open to 20.00 where it found support @ 10 reversal time. Price bounced but was unable to trade and stay above 20.40. Price retraced and found support again at ~20.00 two more times in late day trading.
Oil-
Price retraced from the equity open to find support at ~98.50 bounced to 99.75 but could not trade above 100 and retraced.
2nd day play:
Important levels
20.00 support (tested multiple times and held)
20.25 pivot high resistance from the 24th
20.42 base resistance from the 24th
Oil traded higher in globex but retraced to 98.50 at the equity open.
IMO there are a couple of ways to play EP on the 25th.
Very aggressive can buy on bid support at or a little above 20.00 and then hit out (maybe reverse?) below 20.00.
Less aggressive or add to earlier entry is a break above .25 with a bid hold above this level COMBINED with bullish action in CL.
Lastly an entry or additional add can be made with a price break above .42, a bid hold and continued bullish action in CL.
-B
The resistance/ seller in the 20.40 zone is obious. Show it to any efficient market theorist and ask them to explain (they will likely say this just happens by accident in one out 10.000 occurrences. Sure..).
EP was never able to move decively above this level until 11.30 where it tried 20.47 but was utterly beaten back below the level. Not a superbly shaped&sized reversal bar but fair enough and in the context of the 20.40 a strong signal to short below the reversal bar (I am looking at a 5 min candle chart because I am used to it but it’s also clearly visible on Spencer’s chart). I scalp out 1/3 after 10 cents and close another 1/3 when EP reaches the low of the day (around 20). Hold the rest in case it’s a runner (had EP not been so super strong recently my runner portion might have been larger than 1/3). I’d exit the last tranche between 1.45 an 2 pm at arong 20.10 because at this point the bear seems to have had it and I don’t believe in a runner any longer (relatively strong reversal off the low of the day).
One could have gone long above this bar but it would not be a trade I currently do that much. May be I would have reshorted when the long bear flag started to break down later in the afternoon.
First of all, I’ll just say that I love this blog series idea. It gets us all to think for ourselves and come up with a trading plan. Now onto the trade(s):
(Note: I have not looked at EP today) Since the 24th had that beautiful 40c range, I would look to keep playing off that range if the opening price today fell within it, shorting at $20.40 and covering/reversing near $20 until I saw something that convinced me to do otherwise. If the open was within the range and then broke out either way, I would jump on that breakout, especially if it could hold over $20.40. A break to the upside would have me starting to look toward the next whole number ($21) for possible resistance. If it reached that point, then I would watch to see how it reacted against the whole number. If it did look like it was providing resistance, I would likely close at least half my position. If it blew past the whole number with little hesitation, then I would likely add more to the position. If it didn’t reach $21, then I would look for consolidations to reevaluate the likelihood of the next move.
@022375588ad4e34aa95d2ec286858b50:disqus
A breakdown under $20 would have me looking toward $19.60 as a first possible support point, since this was the high on the 22nd. Once again, I would watch this level closely to see how it reacted. Like on the move up, if it did not pause at $19.60 then I would likely add more and look for it to perhaps close the gap. Of course, any consolidation would be watched closely to see if that could give hints as to where it was going next.
If it opened above or below the 40c range, then I would likely watch to see if I could get in on a consolidation or pullback to the range as I generally struggle with opening a position that is not against a support/resistance point since it makes it harder to define my risk.
I forgot to mention that if it broke out of the range and I opened a position, then going back into the range would be my exit point.
Here’s how I see this in hindsight.
Do you guys typically post your stocks in play? Thanks