Before training at SMB I used to rip through charts religiously. I called it the “poor man’s training program” :-). This was several years ago, but I still rip through charts. I find it to be a very useful source of trading ideas and for getting an overall feel of what the market is doing across multiple sectors.

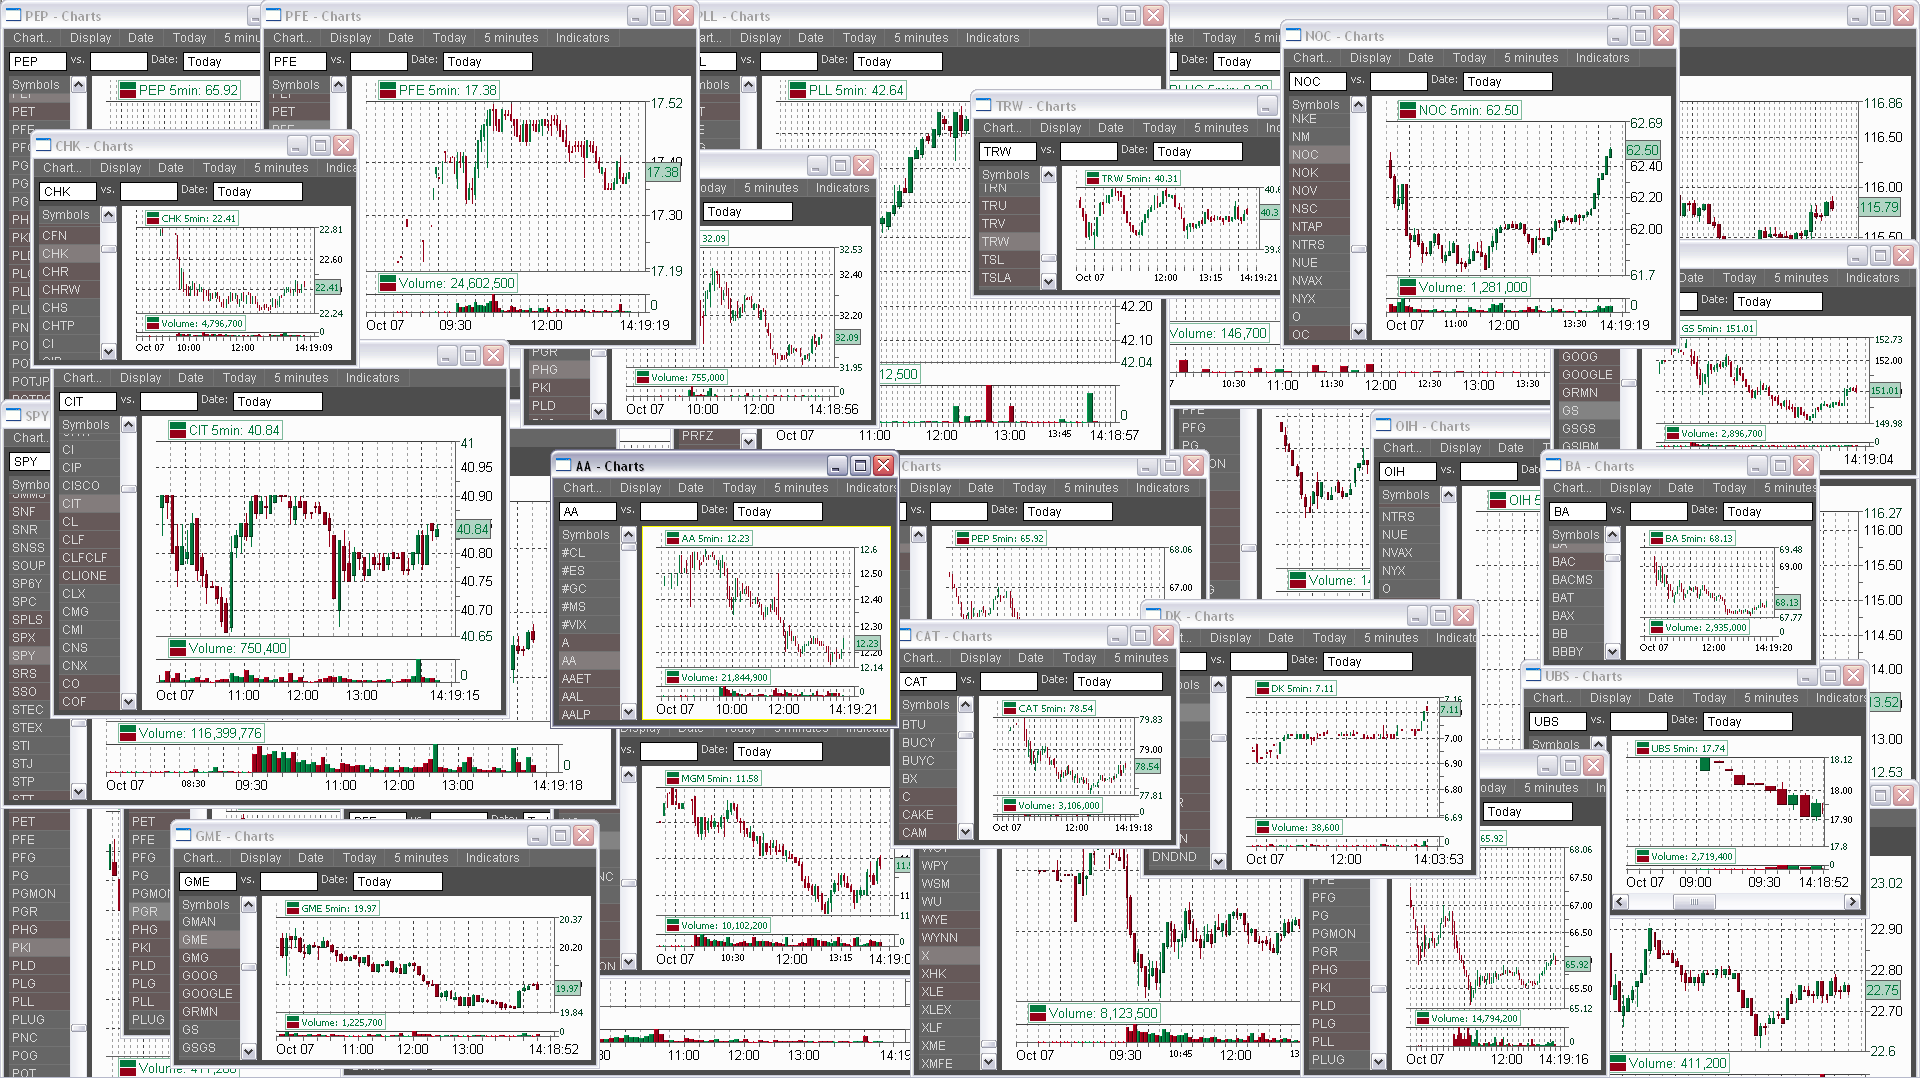
Ripping through charts is the act of looking at as many charts as you can in one sitting. There are a variety of different approaches to ripping through charts, and I’ll cover some here, but the most important approach is to just do it every day when you’re first starting out. It doesn’t need to be complicated. I can even save you the next several paragraphs below with four simple points:
- Rip through 100+ charts after the market close every day
- Rip through the charts of stocks that fit your experience level or current trading style
- Take note of charts with potential trading setups
- Review the charts you took note of the prior day and try to figure out why they did what they did
Why
Ripping through charts exposes a new trader to more market patterns. It can take an untrained trader years to absorb enough market patterns to become consistently profitable. To gain an edge, you can develop exercises to increase the amount of market patterns you take in every day; thus reducing the learning curve. Exposing yourself to as many charting patterns as possible at the beginning of your trading career is one of those exercises that will make a big impact on your development. Dr. Steenbarger has written extensively on market patterns through Traderfeed.
Even if you are a semi-experienced trader trying to improve, ripping through charts and finding a stock with a potentially good technical trading setup and using your trading skills and trading methodology to trade the setup is a powerful learning experience; whether you make money on the trade or not. Over time, and analysis, you will learn what charting setups are most likely to gel with your trading style and trading plays.
Ripping through charts also exposes you to more trading opportunities. If you are the kind of trader who is stuck in a rut, trading the same stocks every day and not improving, rip through some charts. Find potential trading setups that work for you in stocks that work best for your trading style. Practice trading those new stocks on a demo platform or live with small size.
Ripping through charts also gives you a great feel for the market over time. Through sheer repetition you get a feel for how different sectors are moving and how the market as a whole is trading and what trading plays may be more viable than others. Even if I do not trade one idea from ripping through charts, the overall perspective I get of the market is worth the daily effort.
How
Rip through at least a 100 charts every day. It doesn’t matter how you get a hold of the charts, just do it. For the sake of brevity, here are just a few ideas:
- Find the stocks that are the day’s biggest winners and losers
- Look at the charts for the stocks that are in your basket
- Look at the charts for all of the stocks shared by other traders
- Look through the top 10 most influential stocks in every major sector
- Look at the charts of different markets, futures, or market ETFs
- Use a stock filter or screener to identify only stocks that trade best with your experience level or trading methodology. For new traders, you may want to set a daily volume minimum and look for stocks that fall between particular prices; such as stocks that trade above $10 and below $70
- Find filters that let you identify potential trading plays that work best for you. If you make a lot of consolidation breakout trades, then find a filter that will help you identify stocks that are consolidating or near important resistance levels and rip through their charts looking for potential breakouts
- Use a filter and look for stocks that have traded with higher volume than normal
- If it is earning season rip through all of the stocks that are going to report or have reported for second day plays
- Rip through the charts of stocks you took note of the day before when ripping through charts.
I usually rip through charts after the market close every day. This seems to be the most reasonable and flexible time for the average full time trader in the US time zone. You want to write notes when ripping through charts. I do not write down every stock I look at, just the charts and details that appeal to me. You’ll probably find yourself writing a lot of ideas down when first ripping through charts before you get the feel of it.
Write down the symbols of stocks with good potential trading setups for the next day. Write down the important price levels or the types of trading plays you expect to occur. Take note of peculiar technical patterns and other indicators that you find interesting. Do you see a lot of stocks in the same sector with similar trading setups? Maybe you should write that down. What if one of those sector stocks is not trading with the rest of the sector? That’s interesting. Maybe you should write that down.
A vital part of the process of ripping through charts is the review. You should look back over the charts of some of the stocks you wrote down the prior day and ask yourself: “why did they do what they did?” If you jotted down the trading play you thought would occur and it didn’t do that, then try to figure out why. Don’t spend too much time on reviewing though, or else it will drain you mentally. Figure out a way to rip through charts that fits with your schedule; including the review work. I usually recommend waiting for an inactive trading period, such as the midday or after the market close.
As an experienced trader who utilizes some of the ideas gathered by ripping through charts, I will keep track of trading ideas by setting alerts and creating a separate basket of stocks just for those ideas. I only set alerts for the best ideas or in stocks that correlate in some way with the stocks I’m trading that day for indicators. Too many alerts going off will be distracting.
Best of luck with adding this exercise to what you’re already doing.
rOy
4 Comments on “Ripping Through Charts”
For the last 10 years I have been a Worden TeleChart subscriber http://tinyurl.com/2dawlr8 .
One of the most useful features is “Slide Show”. I can create a list based on any filter(s) as Roy described, fire up Slide Show and a chart for each item automatically appears for any duration I desire. On weekends I go thru all S&P 500 stocks in about 2 hours. The chart patterns for stocks in the same sector quickly becomes apparent. I also speed through all of the Indexes looking for patterns.
Great post — thanks for the analysis insight.
-David Duford
Great job – keep up the good work.