Whenever I write a piece like this a fear enters my mind that I will eventually “arb” myself out of the market. Today INFY had Very Large gap higher. Recently, I did a webinar that addressed this trading scenario from a day and swing trading perspective. I also posted this video on how to trade “Very Large Gaps”.
My view on these trades are that when there is a huge change in price that isn’t rejected early in the trading day the stock will continue to trend in the direction of the gap (or at least move sideways). The question becomes how do you define a “huge change” in price? Here are a couple of things for you to consider. What does the weekly chart look like? Is the gap greater than 10%? A break in a weekly trend and a gap higher than 10% is a large shift. A gap above 20% is even better. I referenced a few of these charts in my “New Normal” webinar.
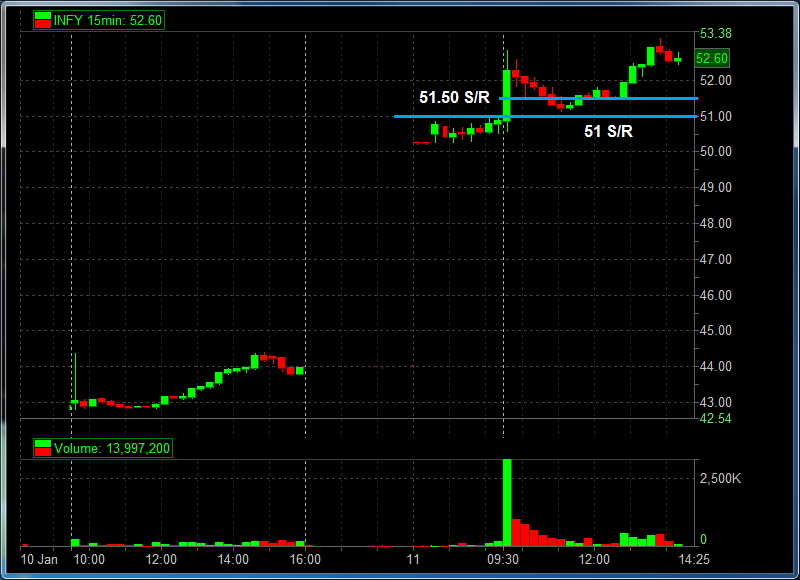
Here are the two relevant charts from INFY today. The key takeaways from the lower time frame chart is that there was an Opening Drive above the pre-market range. After pulling back in the late morning there was a nice horizontal consolidation in the middle of the day’s range before a new uptrend began. That consolidation above 51.50 was a chance to nibble on the long side. Based on the way I measure “legs” intra-day that second uptrend should get to 53.25-53.50. A close above 52.50 certainly warrants a swing position (it closed at 52.20).

The important aspect of the weekly chart is the break of a major downtrend. If you want to see some other good examples check out ANF and GMCR. I mentioned CREE in my last webinar as another possible candidate for a large move if it were gap above its weekly downtrend.

So my focus on these setups are capturing moves in the direction of the gap. I understand from an intra-day perspective there are opportunities to capture counter trend trades. I don’t talk or tweet about them as it is harmful to our trading desk. Developing traders have a VERY strong desire to fade trends. If I was a neuro-scientist I would do the research on exactly why this is the case. But I”m pretty sure people’s brains are wired to want to fade. And the way SMB combats this wiring is to constantly drill following the trend into their heads.

Steven Spencer is the co-founder of SMB Capital and SMB University and has traded professionally for 16 years. His email is [email protected].
If you are interested in developing the trading skills necessary to capture short term moves in stocks take a look at the SMB Foundation training program
No relevant positions
10 Comments on “Eliminating Myself From The Market”
Fading (or in my definition, counter trend trading) is an art. Anyone who tries to fade any stock that is down/up for no reason that it’s down/up a lot will lose more than win. In a highly liquid and volatile market that is great for daytrading, you will probably win more than lose using this strategy. The problem lies with trying to method in all other markets. You will get blown out. I started out trading as a fader because 1) it results in the quickest confirmation of your trade 2) the profits when they happen happen fast, and 3) it was hard to identify slowly trending stocks that could be up/down 4 or 5% more by the end of the day because it happens so slowly and one doesn’t have the patience to hold a long/short for that long, nor can you confirm whether the stock will trend in your direction until after some time.
Trend trading is definitely easier for the newbie because it’s easy to identify new breakouts, new highs, and the path of least resistance is the trend. But like they say, trends occur about 20% of the time and the rest is just regular oscillation.
If you combine a highly tuned grasp of identifying likely pivot points (the moment a stock reverses and the bread and butter of the fader), how a stock acts at pivot points, employ quick trigger finger to exit positions when you’re wrong (and enter in again at the true pivot point), use smaller size to prevent large draw downs, identify the larger general trend of the stock from an intraday, weekly, yearly, and multiyearly perspective (identifying the forest instead of focusing on the trees), and use sound resistance/support levels, the fade trade can be just as effective and P&L building to your account as the trend trade.
It’s harder to fade new highs in stocks because of HFT’s in my opinion, but especially countertrend trading bottoms in a larger term uptrend is a great weapon to have in any trader’s arsenal. Overall I think fading is something that can be learned although it may take a while, and can be emotionally taxing. But the reward and affirmation is definitely there. Over time, you become better at figuring out what fades to fade and what to not fade.
Even the great traders like Paul Tudor Jones, Soros, Livermore etc have all stated that some of the greatest money is made on the pivot points and market turns.
The only trade I took was buying it at 51.85. Not only was this a breakout on the hourly chart, but the MA’s have finally caught up to it. The trade was to buy 51.85, core + scalp as the spread was .05c wide. Offer up 1/2 at 52 incase of a large spike, which didn’t happen. It held 51.80 level, so you add above 52 for a move towards the highs. If it wouldn’t have been able to hold 51.80 after lifting 52, then you get out of you extras and give your core to below 51.50 as the risk/reward is still in your favor.
Fading is a difficult strategy because you are going against the trend in multiple time frames. Even a stock may have gapped up significantly, the short term moving average such as MA10 and MA20, in the 1 minute chart may be right below the stock price. While some argue that a 1 minute close below these 2 moving average represents shorting opportunity, bear in mind that the MA10 in the 5 minute chart will be approaching from below as a potential support for the stock, and then the MA10 in the 15 minute, it goes on…
In short, there are just too many rising moving averages that you need to fight, when you counter trend a gapped up stock. However, if your stock does break these support, you may end up with huge profit as trend traders have their stop loss triggered. That is “IF”.
I agree with profader that gapping seems to be an easy strategy because you get to know them prior market opens, and you have more time to know in advance where your entry and stop will be. Also, it is hard to find a good setup using trend following technique, in which there may be none, even after waiting for whole day, if not week.
It makes sense to look for low risk, high quality setup, and always trade inline with the trend. But a good setup which offers profit/risk ratio of 2 is not easy to find, unless you have a team that continuously scans the market for you. There are less than 200 counters suitable for intraday trade, with ATR of above $1 and with above 1 million shares traded per day. As of Friday January 11, there was only 1 good setup. It was MUR. You can see it on the 30 minute chart.
Happy trading.
The ability to know which stock to avoid based on technical are most crucial, followed by knowing which are the potential ones. From the potential ones, it is important to find 3 best possible counters, in which the entry has lowest risk.
, 5, 15, 30, 60 minute will likely to pointing up, and continue increase in value as they are dynamic in calculation.
David Yuen, you are a newb trader. Average traders rely on averages to tell them how to trade.
Hi profader,
Not really new in trading, it has been 7 years. Just that have not looked into fading strategies. Wish to learn more about it though…
I don’t trade based on moving averages alone. However, I pay respect to all of them because they do affect price movement.
I trade based on swing trading. Usually look for a small doji with dried up volume, that is formed very near right above a rising moving average, or very near right below a descending moving average, ie, MA 10 in 30 minute chart. I also draw thed 2 day intraday fibonacci retracement, to ensure that the reversal candle is at 23.6% F/R level. The intraday high/low should never extend beyond 38.2% F/R level to avoid entry in an over extended range.
There were only 2 setups today that matches my requirement, out of 170 counters that I scan in the morning. They are SNDK and MON. SNDK returns 2:1, while MON 1:1 based on profit/risk ratio. I have also recheck the remaining 168 counters. These may be the only 2 counters are deemed justifiable to trade for 30 minute chart traders who rely on moving averages and F/R levels. If I missed any, please advise me.
Happy trading.
David Yuen, I’m a daytrader and would never touch a stock like SNDK with a 60 cent range in one day.
If a stock has a 60 cent range I would play it if it was like 4 or 5 dollars and I would play 20K+ shares per trade trying to make 10 cents to 30 cents per trade.
I guess you are a position trader. I’m a daytrader. I don’t really know what you are talking about. I have no idea how one calculates risk/reward ratios or if those fibonacci stuff really works.
I just look at so many charts in my life from trading so much and then after a while, I recognize what will work and what won’t. If you look at stock movement tick by tick for long enough, you’ll recognize things.
Profader, yes, the average daily trading range on SNDK is relatively low, for the share price it commands. The ATR(14) is about $1 per day. The lowest daily range in the past 6 month was $0.46, max is $2.4.
The 30 minute reversal candle that I looked at is formed from 10:30 – 11:00, with range of 0.10. Below it is the rising MA10 at 46.95, as well as the F/R 23.6 at 47.02 that went across the reversal candle.
My first target buy is at 47.12, 5 cents above the reversal candle’s high, with 1/4 qty of the intended positions, second buy IF it comes back down to between 47.02 ~ 47.07 with remaining 3/4 qty of the intended positions, provided if the stock still trading above all moving averages.
Initial stop loss is based on reversal candle low minus 2 cents, therefore 46.95. Tgt sell is intraday high at 47.46.
Regards, David.
Wait so you’re trying to make 46 cents in that trade? How many shares are you trading? You used your stock scan out of 170 counters to find two plays that give that opportunity? Out of the whole trading day?
SNDK hit your intraday high at 47.46 at the open. Did you sell it? I am thinking you still have the position since you entered in at 10:30 to 11 am and it traded relatively flat after that.
I’m not criticizing your scan. I don’t know if you’re using a program, but sounds like you are. The fact that your trading style was able to find two setups like this out of 170 stocks that moved today is somewhat discouraging.
Well if your setups that lead to these trades are very very high probability and you can enter in a trade with a LOT of shares, that’s great.
However, if you just trade the ticker and use a discretionary approach built from your good eye for stock movement whether it’s fading, trend trading, breakouts/breakdowns, whatever, you can make 50 cents on a stock on dozens and dozens of stocks every morning. At least
Anyways, if your method works that’s great. I use no program, and just use all discretion only. The algorithm is in my head. Of course it took a lot of lost money and time to get this mental algorithm in my head. But you are going on an overnight trade to make 50 cents. What if the market gaps down for some reason or there is bad news in the flash memory industry. Anything can happen.
Well there is more than one way to fry a fish and we all see the market our own unique way. I am somewhat mad at myself for not buying AAPL yesterday. I day trade but sometimes I like to get into options overnight at extreme levels of price for an extra big boost to my account.
Hey your SNDK is up nicely today almost 48. Hope you held all your shares and made a nice gain.
I traded some HLF today and up a little bit but nothing crazy.
The quantity of stocks that I intend to trade is base on the total amount of risk measured from the stop loss, prior entering the trade. If the stop loss is tight, based on the technical setup, I buy more, vice versa.
I do not hold any position overnight because I hate gapping against me. Instead I trade only intraday. As for the stock scanning on 170 counters, I do it manually with eyes with 6 month and 30 minute chart. It takes me about an hour to filter out all these counters. Usually 20-30 counters are selected after first round of scanning. These 20-30 counters are then scanned in detail by drawing F/R in 2 time frame, as well as checking if they have enough room to move base on support and resistance, in all 6 different time frame chart. At the end, A+ setup may be 2-3 counters only. Seriously, I wish there were more, but for low risk A+ setup, there are just ain’t that many.
Scanning is time consuming. My logic is to find stocks that have a potential to be triggered at a common price zone among different time frame traders. Example, a price in which short sellers buy to cover, together with long traders buy to open, agreed by 6 different time frame traders. This is vital for swing traders because after a low risk entry, the stock is suppose to BOOST with momentum with increasing volume along with increasing candle range, else it is a good setup but not enough commitment from traders, like SNDK.
I would be happy if I can make 46 cents with a risk of 23 cents, if the success rate is above 50%. It is not easy if you have a tight trailing stop loss especially if it is based on the 1 or 5 minute chart. The profit is not for us to decide, only the risk.
As for SNDK, I did not sell at 47.46. That was the intraday high, I don’t have the capability to sell at the peak of the day. I enter the trade after 11:00 because the 30 minute reversal candle is completed from 10:30-11:00. After 11:00, I waited for a new high with 5 cents above that 30 minute reversal candle’s high as a trigger to long the stock. Since that 30 minute reversal candle has a range of only 10 cents, I did not bother to refine my entry using the 1 minute chart. I sold it later at 47.36 because it hesitated when approaching intraday high of 47.46 which was made during the first wave of the trading day. My P/R ratio is about 1.4 before comm. and spread. It was not a good trade for me because I expected it to breach above the 47.46, and have a peak price that is about $1 above intraday low.
As for the algo, I print them as check list on the same sheet that contains the stock scan result I ticked. That way, not only I can keep it as a reminder, but also as part of my daily trade journal. I print out every chart I trade or I missed on an A3 size paper, and the paper size is large enough to contain the stock which is broken down into 6 time frame.
You are right, there are many ways to trade, and it boils down to the way we learned and experienced. We both know the enjoyment and tough time been a trader.
By the way, there was 1 relatively low risk setup yesterday, but it was a late setup to the upside. Took small positions on it. It was DVA. Setup on 30 minute chart, 1:30-2:00 candle. P/R is around 1.72 prior comm and spread. I exited because of the resistance at 112.90 in the 5 minute chart being tested few times, and it was late. By the way, my time is 12 hours ahead of new york. It is tough trading with such time difference.