
In this video Andrew Falde looks at combining diversified strategies in different asset classes to create a portfolio equity curve that is reliable and smooth. This strategy set will be an on-going update. * no relevant positions
The Analyst Downgrade Bottom–Micron
When a stock has been in a longer term down trend there are many ways that it can put in a tradeable bottom (assuming it isn’t a commodity stock in which case it may just file for bankruptcy at some point). The fundamental cause of its down trend goes away. This is what happened in Apple in 2013 after its 40% … Read More
Inside The Trading Vault – A look at CL_F
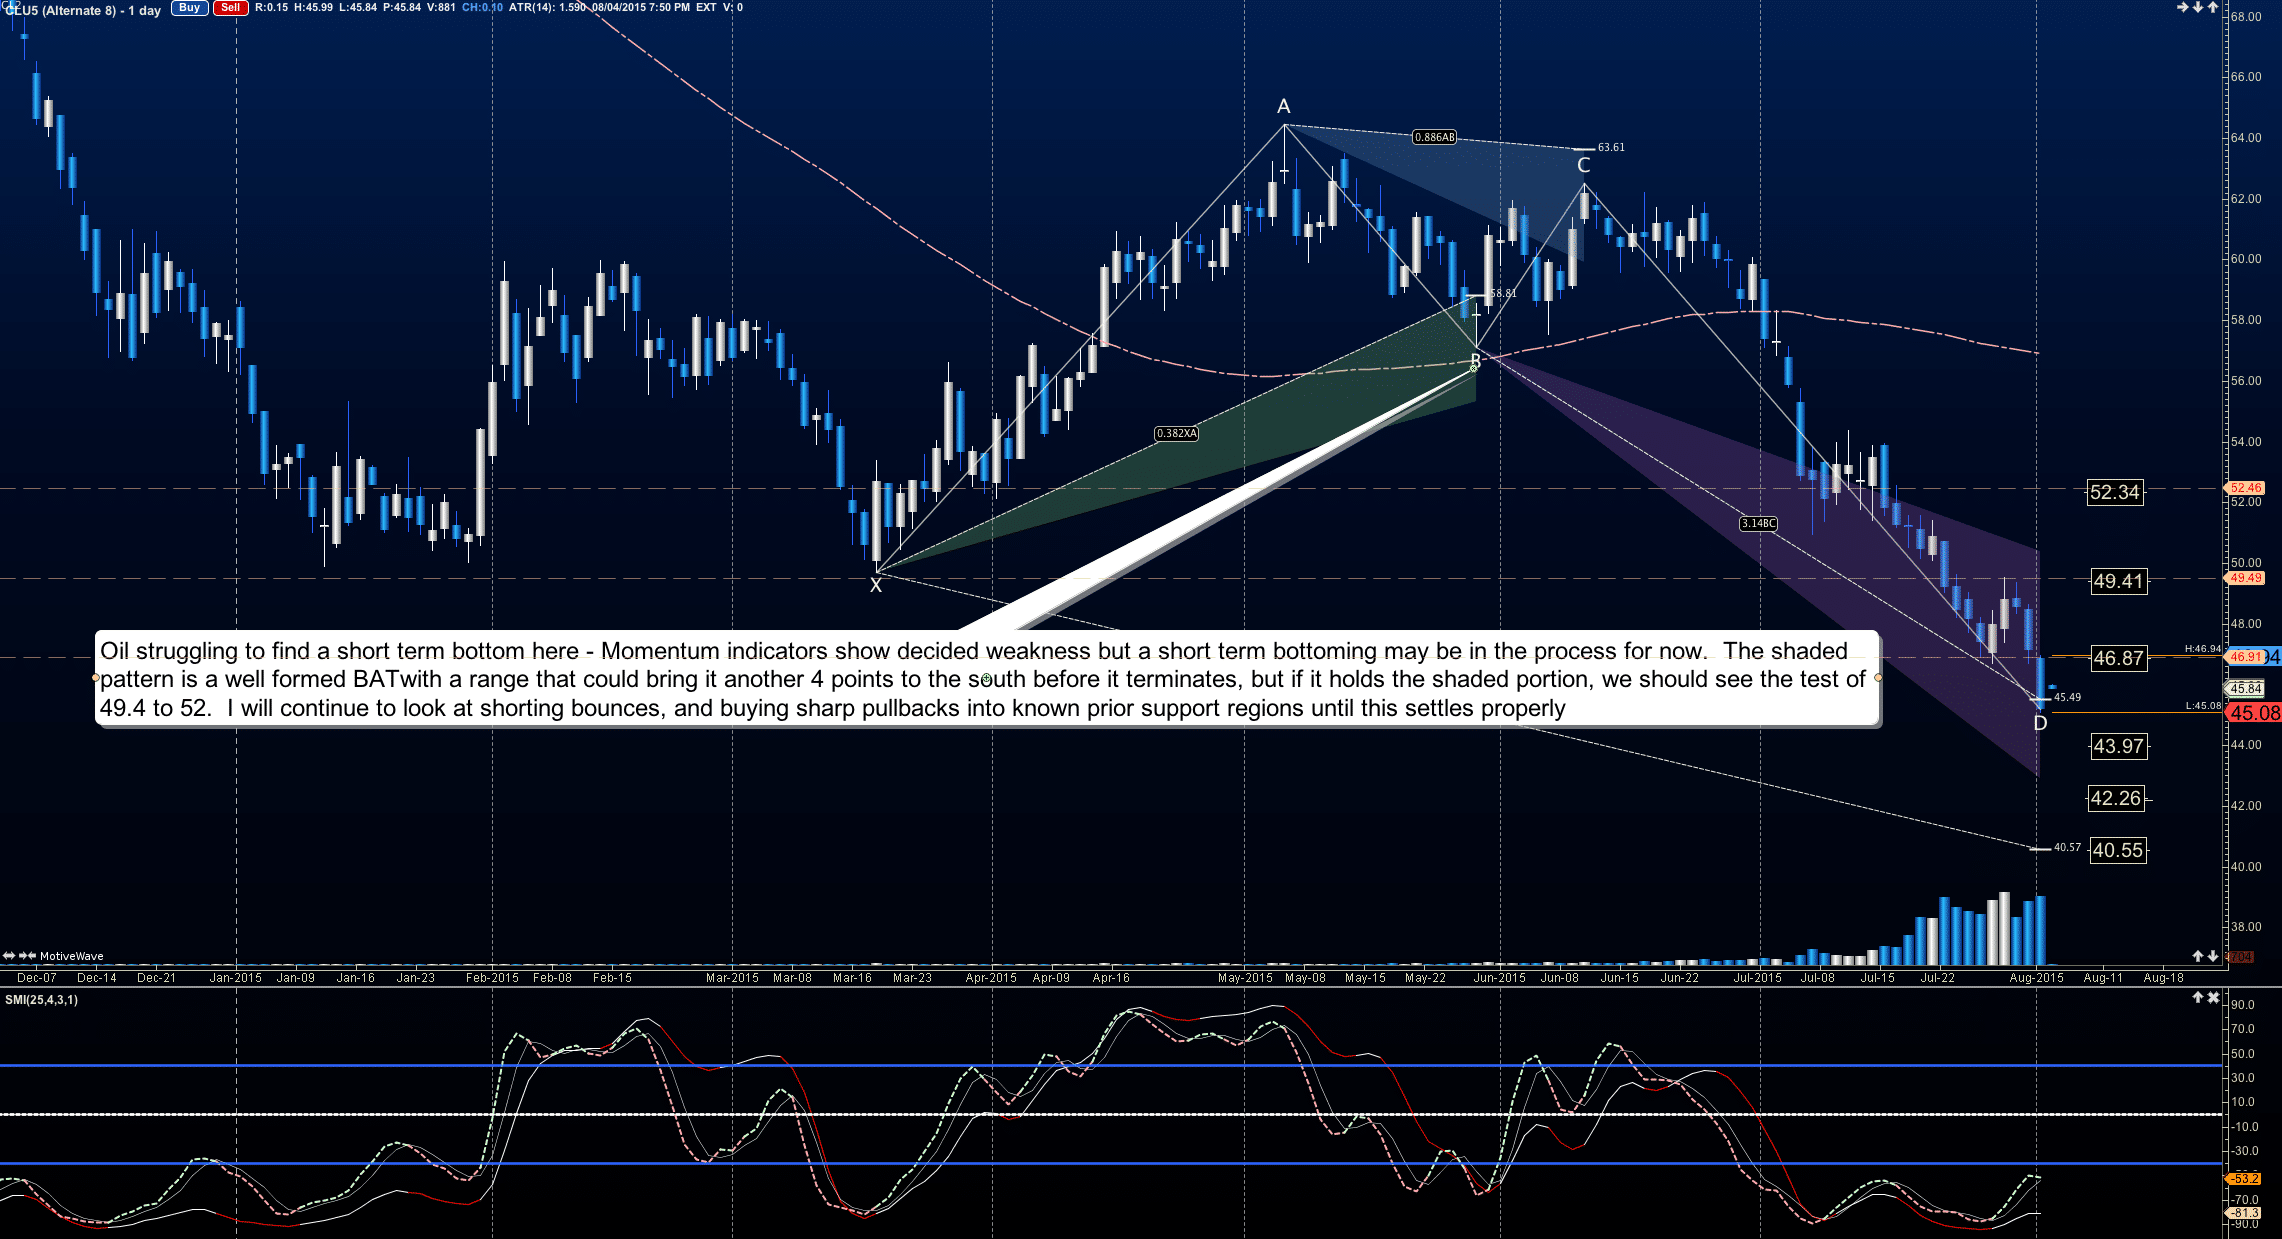
Trading Vault Concept – “When charts are in a trend, we are often tempted to pick bottoms or tops because we FEEL a chart has reversed enough. The slightest drift over or under a level, we trigger our trades to initiate a trade in the direction of the move, but in these markets breakout and breakdown levels … Read More
Study Price Action & Stop Being A Silly Troll
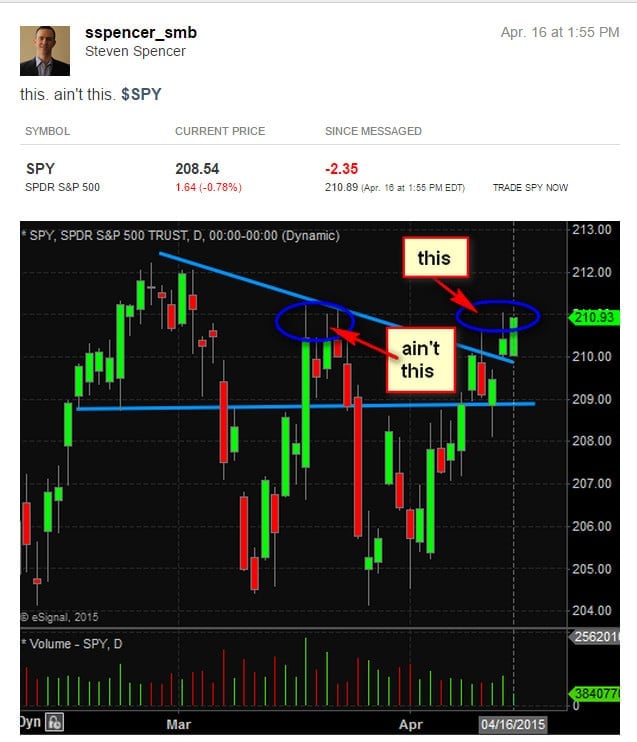
Back in April I tweeted a picture of a SPY chart that I thought was rather instructive. Here is the chart: A few things we can take away. The first is that the SPY 204.30 had been tested in February and then again in March. The bounce in March was very fast moving from the low to SPY 211 in … Read More
Cool Technology With Some Great Ideas
In the past few years SMB has built some remarkable trading tools. We led the pack in moving to HTML5 years before others (can use on smartphones and tablets). But beyond the cool technology in Scanner, Radar, and Real Time it is the actual idea flow that comes from very experienced traders. Traders who have spent years learning how to … Read More
Oracle Had A Fundamental Catalyst That Made It A Good Short
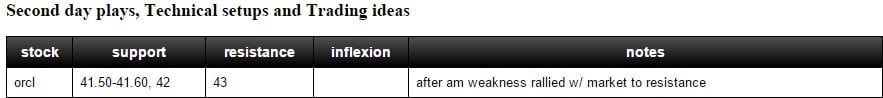
ORCL reported disappointing earnings after the Close on June 17th. The next morning it traded lower before rallying back $2 with the market. I had two reasons why I thought it would roll over again the next day. One, I believed the large market rally the prior day was the primary driver of its bounce from 41 to 43. Two, after large … Read More
Why Netflix Was A Short Today
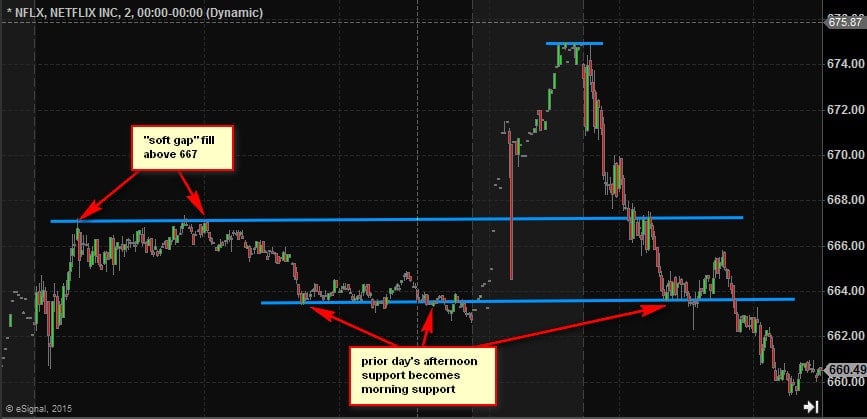
Netflix has been on quite a tear since they reported strong earnings in April trading higher by more than $200. But for short term traders who each day look to trade lower time frame trends NFLX offered a good short setup Friday morning. These are some factors I considered prior to sharing the setup in our morning meeting. Netflix had a huge … Read More
A Low Risk Entry For A Long Term Breakout–FEYE
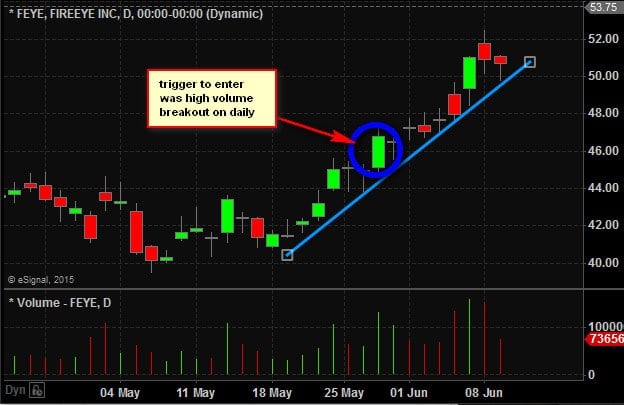
Since the beginning of the year FEYE had been consolidating between 38 and the mid 40s. It has had a lot of positive news flow this year but had many failed breakout between 45-46. I made a conscious decision not to get long in the mid 40s until it cleared all resistance for the year on heavy volume. On May 28th … Read More