This post is another in a series that we will be publishing which track the hypothetical performance of broken wing butterfly trades selected by Greg Loehr of Optionsbuzz.com.
For months now I’ve been blogging about hypothetical SPX broken wing butterflies that I’ve been identifying and managing in live markets. The returns have been positive, with only one losing trade out of about nine or 10. And the losing trade was minor because the risk was a very small debit.
These flies have all been a fairly “standard” implementation of an incredibly versatile strategy. To shake things up a bit, over the last week I’ve been tracking another broken wing, but this time with quite a different approach than what I’ve been doing in the past.
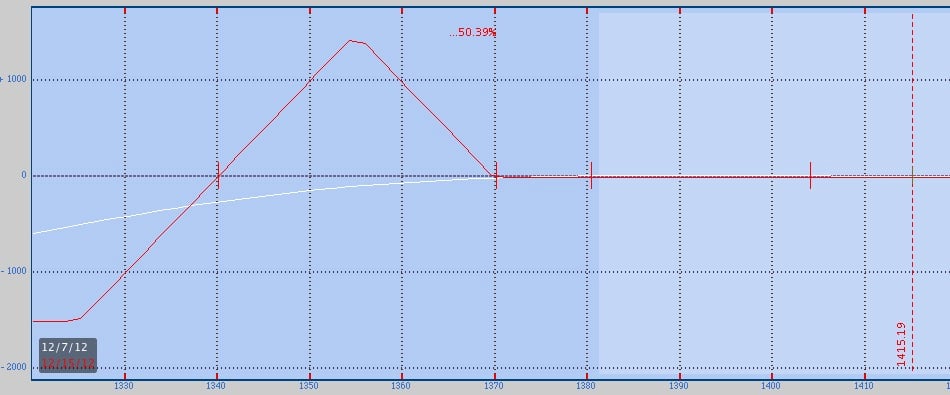
Take a look at the SPX December 14 expiration (weekly) 1370-1355-1325 put butterfly. Currently it is fairly valued at a 20-cent debit, which is what I identified as a potential entry price last week to buy the butterfly.

Those that have been following this parade of winning trades will immediately notice that this one is different. The strikes are much wider with the distance between the near strike and the middle strike of 15 points instead of five; and 30 points to the far put. One downside to this construction is the high margin requirement, which, depending on your broker, might actually exceed the theoretical maximum risk on the trade.
Calculating the risk on the trade is easily done by viewing the butterfly as two vertical spreads (which is all it really is) and taking the difference in their widths. For this example the trade is long the 1370-1355 put spread, and then short the 1355-1325 put spread. The short spread is 15 points wider than the long put spread, hence the max risk of $15.00. Then you add the debit of the trade, or subtract the credit. That produces a max risk of $15.20.
Some brokers, though, might margin you on the full risk of the 30-point short spread, and thus require $3,000 per spread. This shouldn’t really be an imposition or detriment to your trading if you keep a fair amount of capital free at all times (as you should) so that these types of trades are available to you. But despite this high requirement, this trade comes with a benefit that I’ll discuss more below.
The butterfly is also farther OTM with the middle strike around a six delta as of this writing. Although this goes against the rule-of-thumb of using a 16 delta option (covered in the Broken Wing Video series, see banner below), I have repeatedly said that there are a myriad of nuances in this trade that affect construction and management. This is why you need to take advantage of the free coaching that comes with this Video Series.
So why go with such a wide butterfly, especially since it costs a debit instead of bringing in a credit?
First, the debit is small enough to not really worry about. If a trader wanted, he could possibly sell a small call spread or put spread in an amount that covers the debit if that spread goes out worthless.
Second, this trade will most likely produce a profit if the market moves lower over the next week. And it can do so far faster than the “standard” implementation I mentioned above. For instance, a $5-wide fly would most likely lose with a 20-point (or more) SPX drop. This current fly, however, can potentially profit as much as $1.00 in one day with the same amount of movement.
And that profit will only improve over the next several days as theta starts to really kick in. By how much you ask? According to the option chain, in one week with the SPX down 50 points, this trade produces a profit of more than $5.00. These are potential profits of between approximately 7-30%.
With Bernanke & Co. on tap for Wednesday of next week, you never know, right?
Trade safe!
Greg Loehr
Optionsbuzz.com
Please note: Hypothetical computer simulated performance results are believed to be accurately presented. However, they are not guaranteed as to accuracy or completeness and are subject to change without any notice. Hypothetical or simulated performance results have certain inherent limitations. Unlike an actual performance record, simulated results do not represent actual trading. Since, also, the trades have not actually been executed; the results may have been under or over compensated for the impact, if any, of certain market factors such as liquidity, slippage and commisions. Simulated trading programs in general are also subject to the fact that they are designed with the benefit of hindsight. No representation is being made that any portfolio will, or is likely to achieve profits or losses similar to those shown. All investments and trades carry risks.
No relevant positions.