This post is the first in a series that we will be publishing over the next several weeks, tracking the hypothetical performance of the April, 2012 expiration of the bearish butterfly trade as it would have been handled according to our guidelines contained in SMB’s Bearish Butterfly Video Series.
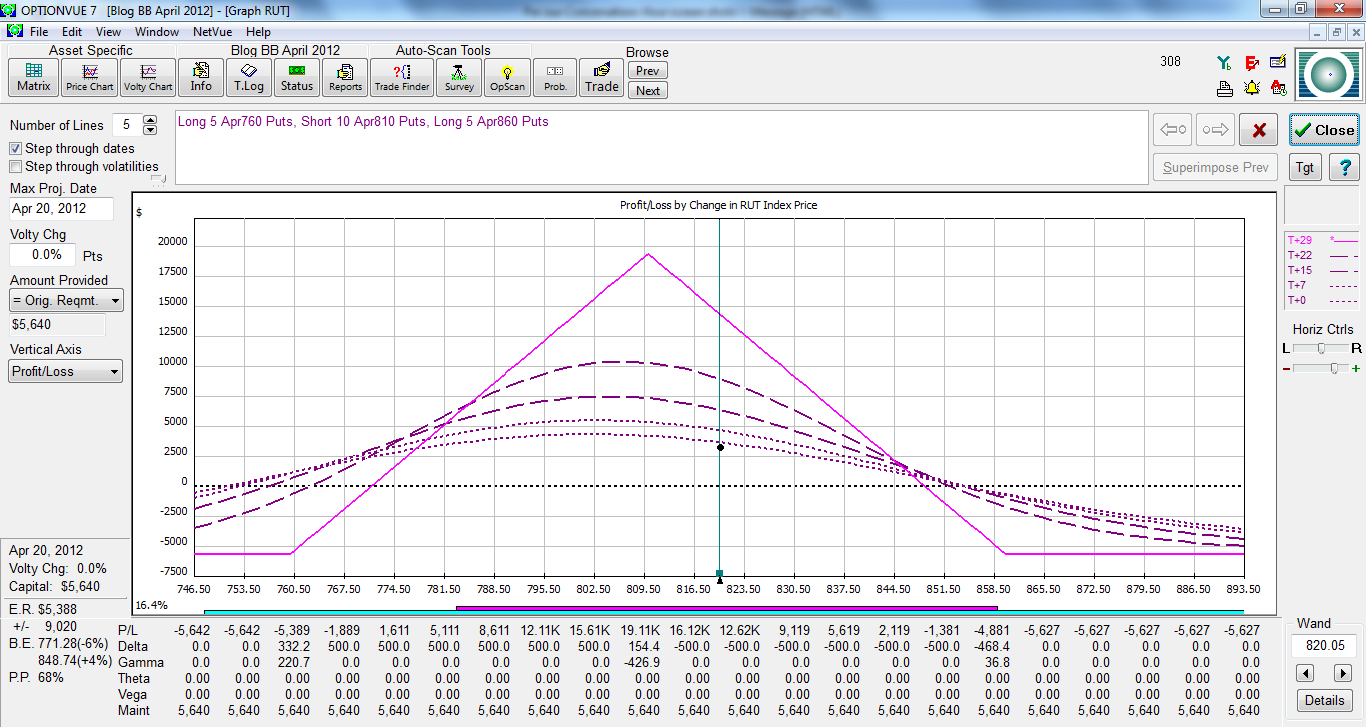
On Friday, February 24, we initiated the April bearish butterfly trade in the $RUT. If this was an actual live trade, you’d need to set aside about $25,000 in your account in order to leave some powder dry for adjustments that you may need to make if the market rallies in an extreme manner after the trade commences. At the time that we initiated our hypothetical trade, the $RUT index was trading at 827. In accordance with our guidelines, we placed a 5-lot put butterfly, centered at $RUT 810 below the market at a cost of 11.21 per lot. So our total initiation capital level is a little bit over $5,500. Here is the trade at initiation:


As of yesterday morning, our position was up 13% of planned capital. This profit can be attributed to two issues. Firstly, the passage of time, 27 days from trade initiation, has significantly improved the P and L of the trade due to time decay. Secondly, today’s sell off has been helpful as the trade is still significantly negative deltas, offset somewhat by yesterday’s increase in implied volatility. Remarkably, we have not had to adjust for any reason in this cycle–no price points have been hit that would have necessitated an adjustment and no greeks-based issues have arisen as well.


We will keep you updated as the trade progresses.
John Locke
Locke In Your Success, LLC
Please note: Hypothetical computer simulated performance results are believed to be accurately presented. However, they are not guaranteed as to accuracy or completeness and are subject to change without any notice. Hypothetical or simulated performance results have certain inherent limitations. Unlike an actual performance record, simulated results do not represent actual trading. Since, also, the trades have not actually been executed; the results may have been under or over compensated for the impact, if any, of certain market factors such as liquidity, slippage and commisions. Simulated trading programs in general are also subject to the fact that they are designed with the benefit of hindsight. No representation is being made that any portfolio will, or is likely to achieve profits or losses similar to those shown. All investments and trades carry risks.