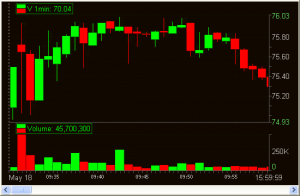
I was trading V today for the third consecutive day. My initial bias was short based on the weakness on the tape I had seen during the prior two days. During yesterday’s two point pop in the SPYs I found it to be very telling That V barely bounced. So I came in today ready to get short again. The futures were higher this morning so V offered a very nice entry point at the 76 level.
My initial short in V on the Open worked very quickly dropping from 76 to 75 in a heartbeat. Then over the next twenty minutes V continued to press up against the 76 level with shallower pullbacks. It was very easy to see on the tape the buyer stepping higher. First, 75.40, then 75.50, then 75.70 and eventually buying at 75.90 on the bid. This was “short term” strength on the tape. When V was dropping in price there were no aggressive sellers holding offers at lower prices. In isolation it appeared that V would eventually trade higher because buyers were being more aggressive than sellers.
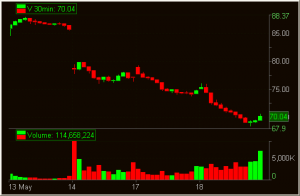
But if you were to take a step back and think about V’s price action going back to its five point gap down on Friday the tape has been showing great weakness on a larger time frame.
1) On Friday after a large gap down from 85 V failed to hold above the longer term level of 79.50 and then trended down to 76 the next long term support level.
2) On Monday V trended down for the entire day touching 73.67 which is right above its next long term support area. They SPYs bounced from 112 to 114 and all V managed to do was trade up to 74.70.
3) And this morning it was being sold at the 76 level which is the long term support it dropped on Monday.
This is a stock that seemed set to head lower over the coming days. If things were to really start to get panicky a move to 65 was not out of the question.
Yet as I was trading it at 9:45AM this morning I allowed the short term strength in the tape to almost wipe my memory clean of the short bias I had entering the trading session. In my mind the big picture in the stock was running up against the tape in the stock. But that was the incorrect analysis.
Almost universally when we refer to “the tape” at SMB we mean the order fly that is occurring in a stock from minute to minute. But the reality is that traders on different time frames view “the tape” in different time frames as well. It is essential if you are making a longer time frame trade to give the highest weight to the tape in a longer time frame. That is where I momentarily went astray.
If I were attempting some type of scalp play then the momentary strength I was seeing on the tape would have been useful to establish a scalp long. But its only purpose for the trade I put on this morning was to indicate to me that I should take some risk off on my short and not add to my position until I found short term weakness on the tape to match the long term weakness I had identified during the preceding trading days.
In fact that is eventually what I did when I finally saw an aggressive seller at 75.12 put the kibosh on the 75.10 buyer. And I did this a second time when V was being sold at 74 and the large buyer at 73.89 got hit out for 94K shares. The weakness on the tape in the short term was matching the weakness of the tape in the longer term, which was my signal to be more aggressive.
Conclusion:
1) If you have a big picture trade idea use the short term alignment of the tape to press your advantage
2) If you have a big picture trade idea and the short term misalignment of the tape to take some risk off BUT don’t change your bias


5 Comments on “Reading the Tape In Multiple Time Frames”
Steve, a few questions if I may.
Was the aggressive selling a big block or refreshing that took place. Or do you refer to aggressive selling at multiple touches of a certain price and the stock coming back down?
Did you get aggressive with your short 76.10 or did you take a feeler?
Did you add to your position anywhere below that price? Quite a few traders complained they couldn’t make money on V today, I believe it is because of the programs spiking up the price while they are aggressively adding lower.
This type of chart formation is in my A+ setups to trade. I’d like to get great at this play, thanks for the post.
Very interesting blow by blow account of a trade.
Very interesting blow by blow account of a trade.
Very interesting, thanks for the analysis. I wish we could watch the tape on this especially around 76 level and lower to spot the held offers.