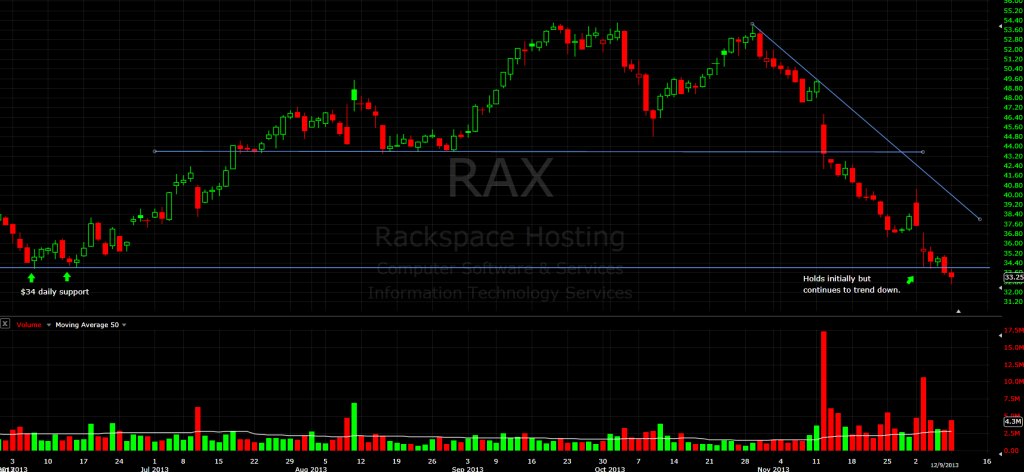
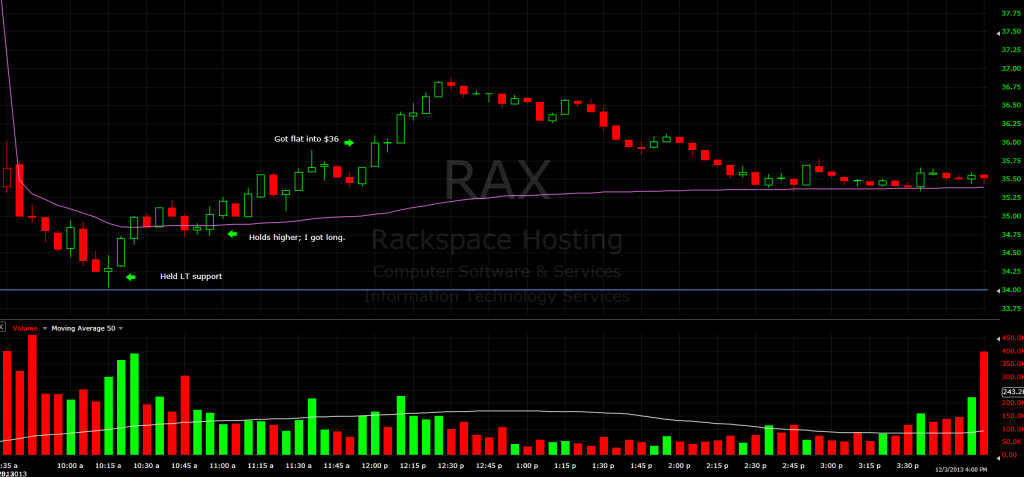
This stock has just been crushed: after topping out at $54 back in October, it has trended down to the low 30s. Last Tuesday, RAX was coming into longer-term support on the daily at $34. I got long the stock intraday after it had held that $34 level and captured a point in the trade (admittedly leaving some money on the table). The thing to remember with any type of fade trade is you need to take your profits more quickly than you would if you were trading with the trend. This is due to the increased probability of the trade not working and continuing in the direction of its longer-term trend.
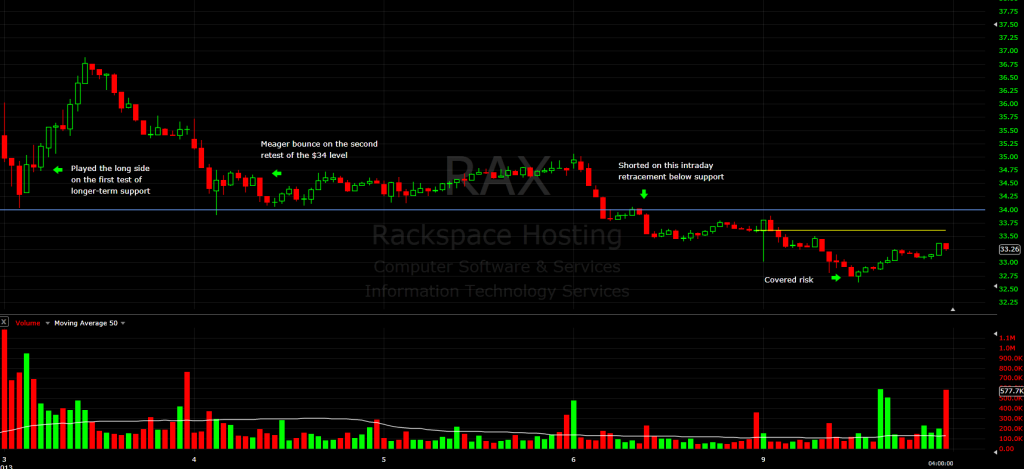
The following day, the stock bounced again off that $34 level, but was much more feeble than the prior day’s bounce. I continued to monitor that $34 level going forward. On Friday, RAX drove through the $34 level and I shorted it into an intraday retracement. I’ve been swing short the stock since last Friday. I covered about ⅓ of my position today to cover my risk, but I ultimately believe the stock could see $30-$31, which is the next longer-term support area. Remember, the original long play at $34 was a fade play. While I will buy into longer-term support, the trade is a lot different than buying a pullback in a strong stock because I was trading against the overall trend. You can definitely make countertrend scalp plays, but the key is to recognize the type of trade you’re in and have the appropriate risk for that type of trade.
5min chart of RAX showing initial test of support (12/3/13):
5day, 15min chart:
If you have any questions or comments, please just let me know.
StockTwits: @MarketPicker
Twitter: @MarketPicker
Jake Huska
Related blog posts:
Risk: SO Not Just a Game
Improve Our Performance by Watching


