Trading Vault Concept –
“When evaluating a chart, continually ask yourself why buyers or sellers behave in a specific way – and what it means to them when support and resistance levels are made and broken”
Many of us are up and coming traders who have consistent issues with the ‘WHY’ to enter a trade. Meaning, we don’t have a hard lock on when to get into a trade- probably because we have some kind of deep seated feeling like it is a gambling event. So we tend to roll dice.
Those managing large amounts of money or very large portfolios do not move without proper reasoning- and lots of it. Not saying that the reasoning is correct, but that it exists; it is a part of general risk controls, and that it can be seen in the market structures. We should take that into our own trading spaces.
Let’s have a look at KO –
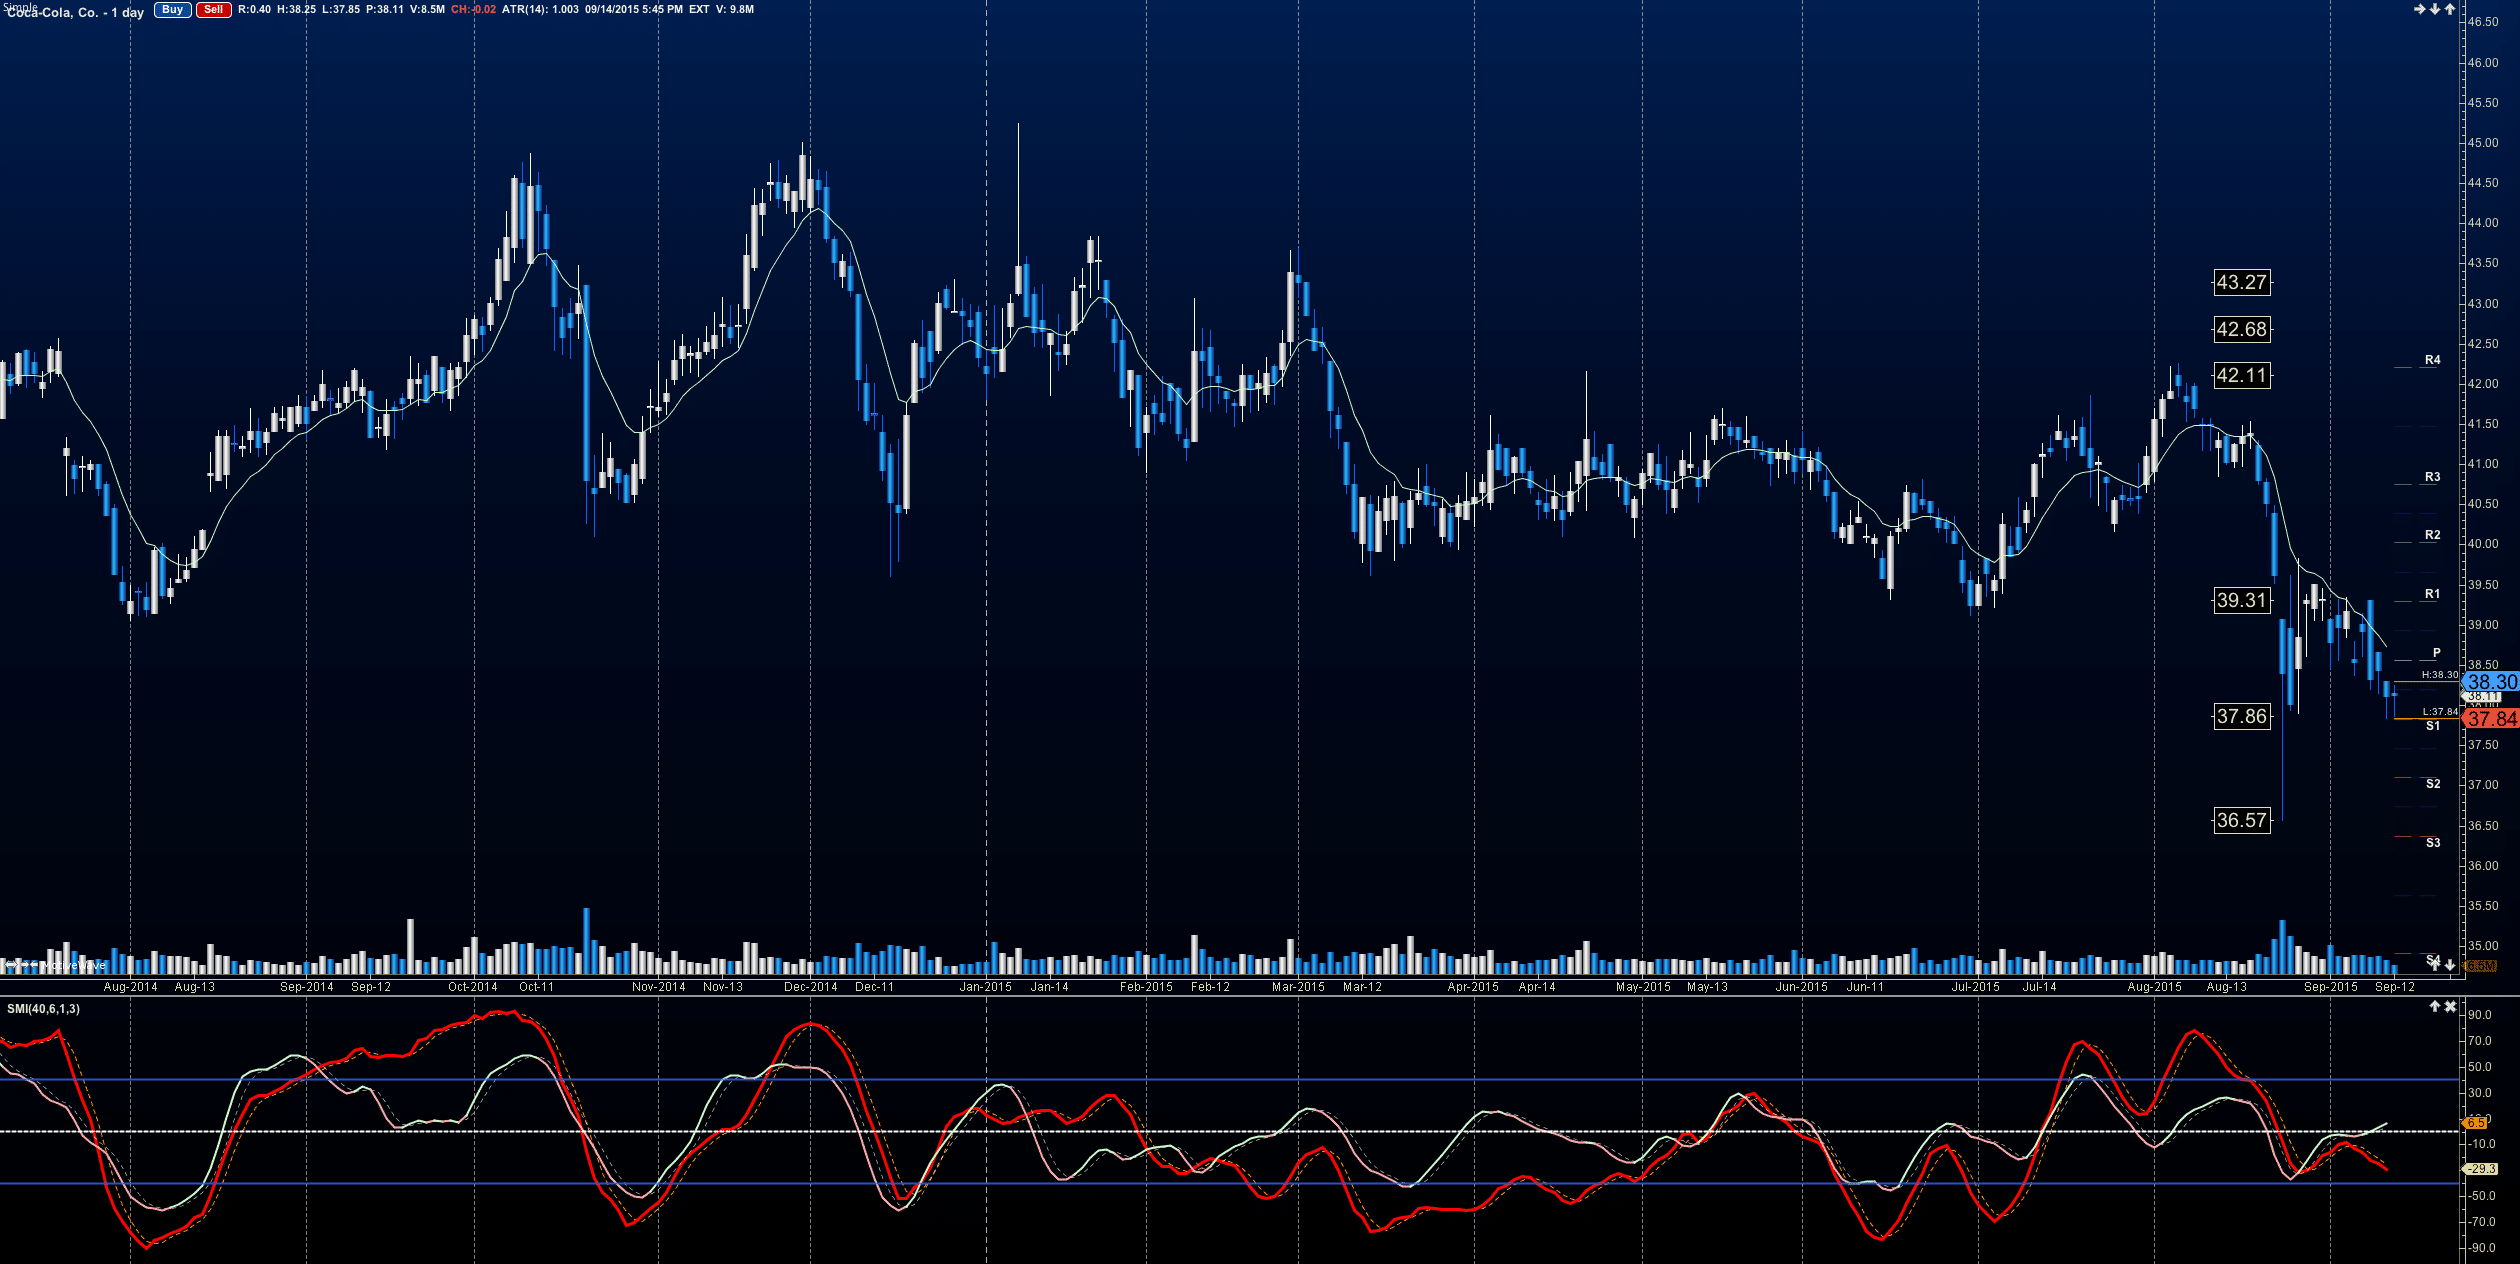
This chart was moving through a channel since April – with a few minor breaks that recovered quickly. Then came the China syndrome and today we are revisiting critical support levels in this stock that shows real danger of loses the levels before bouncing again.
We’ll need to look at the four hour chart to see how my swift cycle swing trade setup looks for this one.
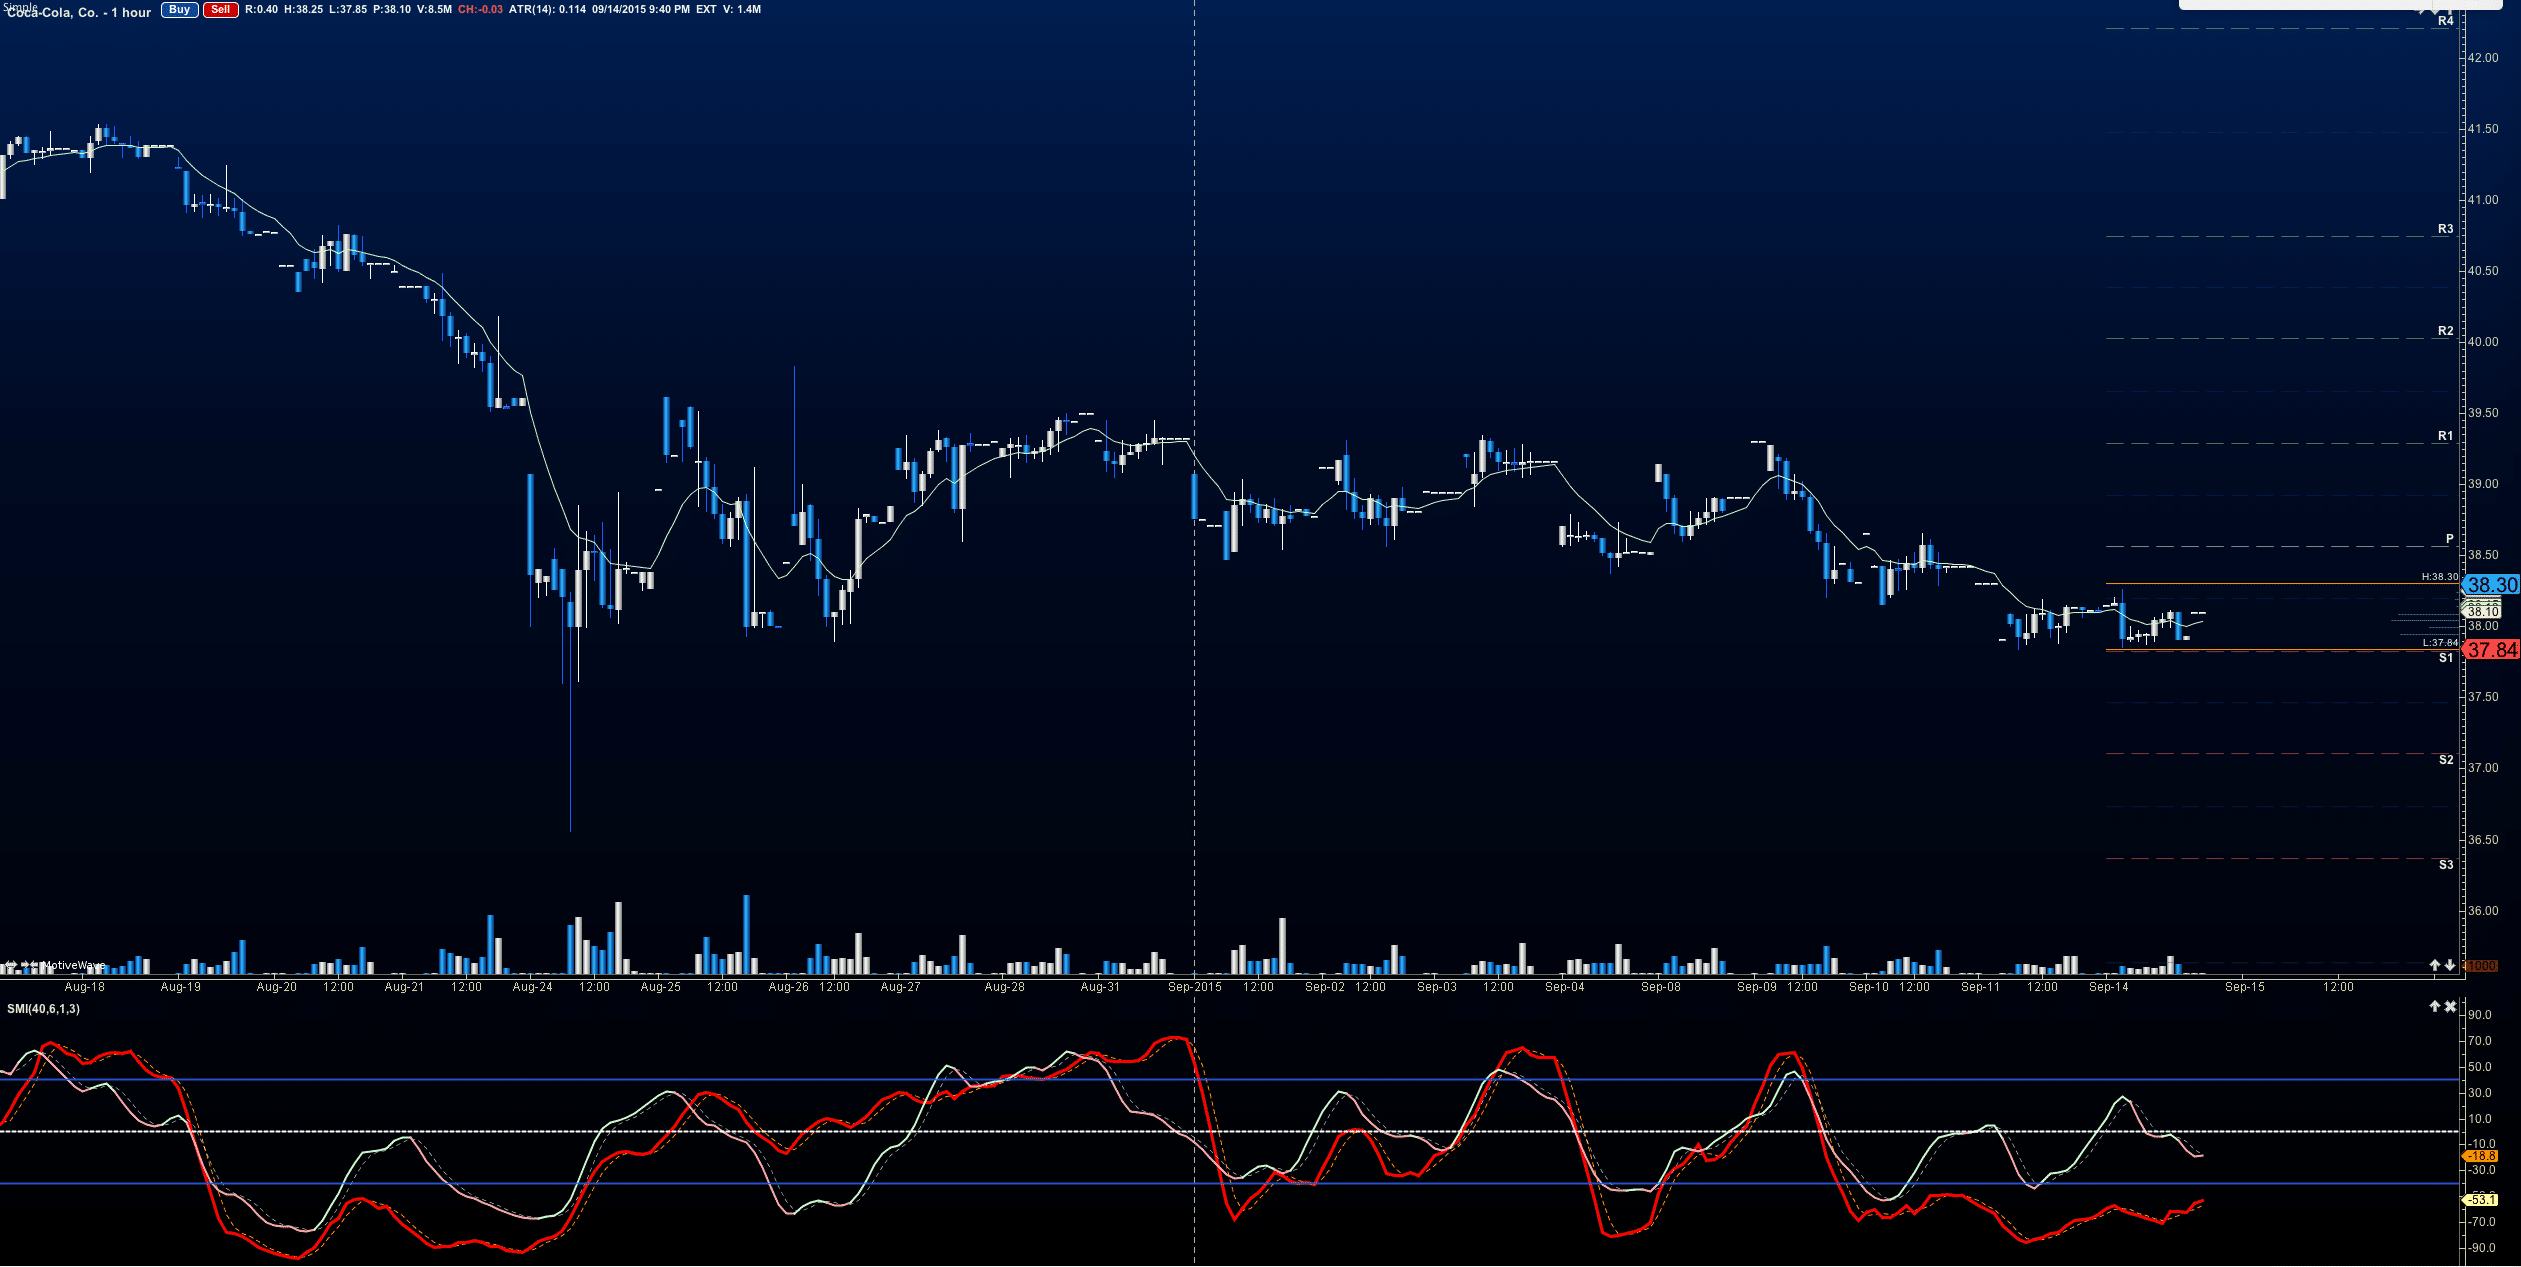
The channel shows up quite clearly in the four hour chart. Many folks have the trading mechanic of taking the short at the loss of support or taking the long at the breach of resistance but to me this exposes me to unnecessary risk – something I am continually focused on minimizing. Incidentally, this chart could go either way, so I’ll be prepared for that in the following way.
If the KO chart bounces above 38.7, I’ll put a conditional order for THE FOLLOWING DAY in to go long at 38.33 pullback in a 1/2 sized position; my stop will be at the 37.8 region. If it retraces into 37.8 and begins to bounce holding positive momentum, I will add to the position as it rises above 38 to make it full sized. My initial targets upward will be 38.89, 39.31, 39.67 and 40.17 where I think it is very likely to reverse and lose this channel bottom again – If the chart bounces sharply, I will adjust the entries for the following day (and update this post with a new one).
If the KO chart fails to hold 37.7, I’ll put a conditional order for THE FOLLOWING DAY in to go short at 38 in a half sized position; my stop will be in the 38.4 region. If it retraces into 38.4 and begins to fail with negative momentum, I will add to the position as it loses 38 once more to make it full sized. My initial targets downward will be 37.36, 37.1, 36.73 -If the chart fails sharply, I will come back to the trade setup and look for adjusted entries.
This trade setup, you’ll notice is much more structured as the wait state is drawing to a close for KO but still exists for GPRO.
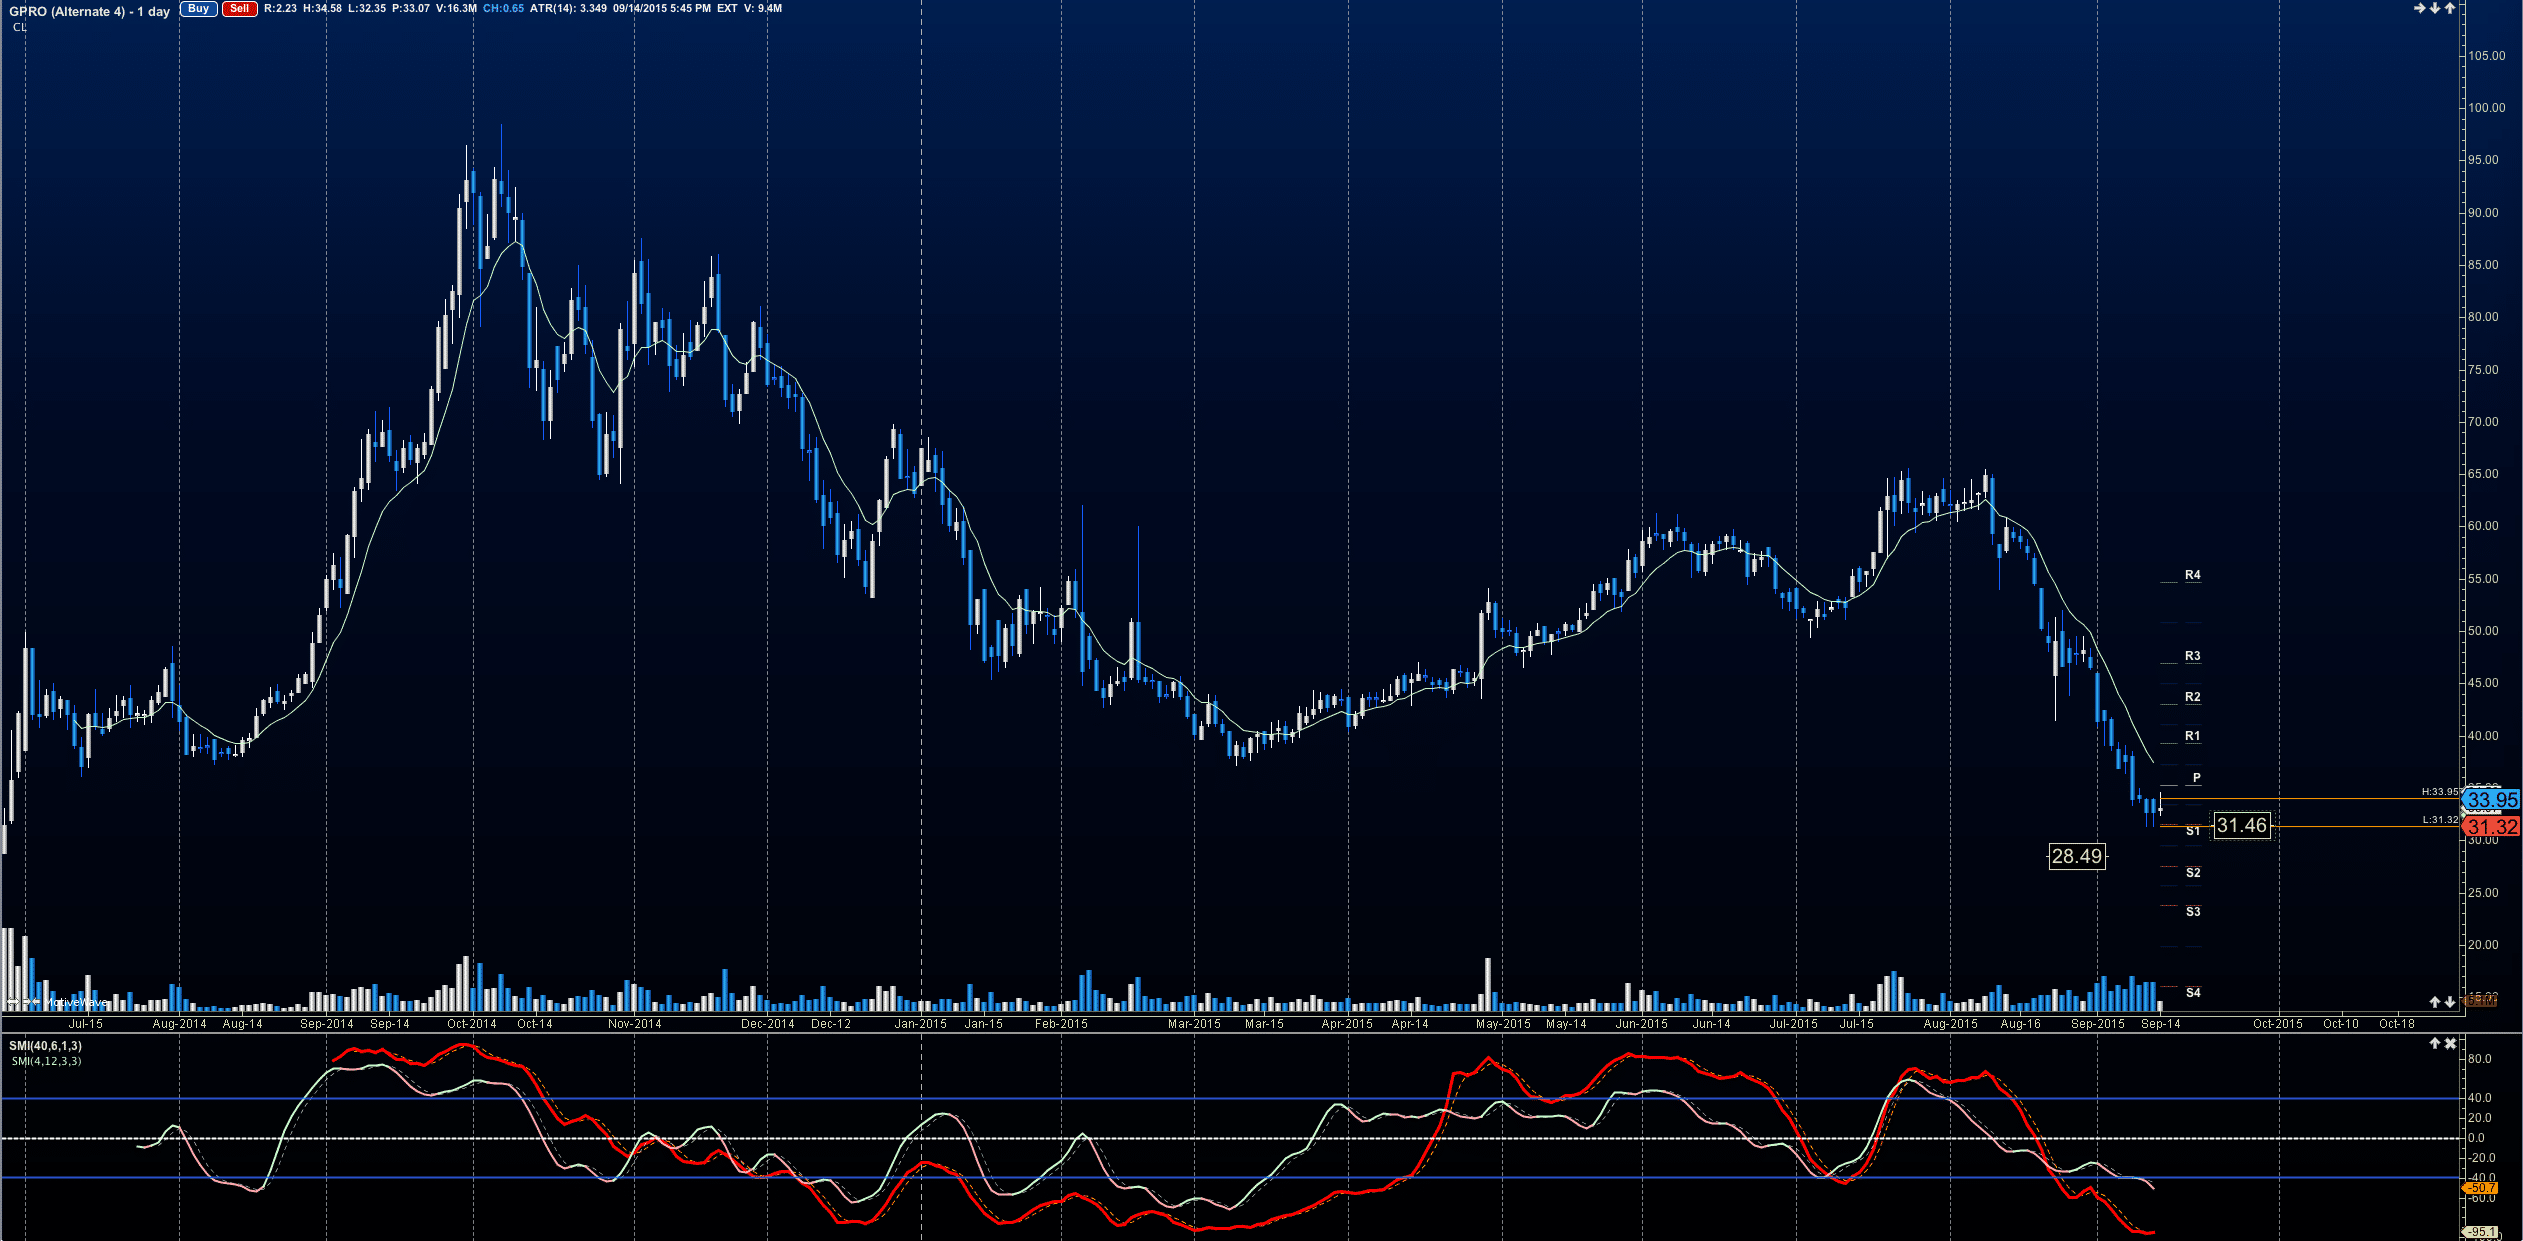
Now, let’s consider GPRO –

Something that bottom pickers love to do is try to isolate turning points in the stock using a variety of tools. Thursday, many folks were discussing the probable bounce event coming for my favorite camera on the go – I think GoPro is a lot more than that – but we’ll leave that commentary to someone much more qualified at fundamental analysis than I. Instead, we’ll look at the chart in the framework of probabilities and market structure, with which I have a great deal more experience and knowledge. And this chart could go wither way here ( though I suspect we see something lower before reversal upward- meaning that a breakdown here, unless quickly taken may end up being a bear trap)
It is clear that a group of buyers were significantly disappointed when the chart lost the 38 area and after three days of testing the region, the buyers raised the white flag, and left the trade, or became sellers at that point. A new line of buyers is now sitting at what I suspect to be a feeble support structure near 31.4. Just because I call this feeble support does not mean that the chart cannot lift from here. What I am suggesting is that the chart may lift but it will fail before settling in on a price that possesses more stability.
So knowing what we know, how can we set this trade up over the coming days? We are in a wait state for any kind of swing setup, though some very interesting intraday trades might unfold here.
When I do analysis for intraday trading, it is rare that I look at time frames that are smaller than an hourly -the longer the time frame, the higher the level of reliability in the strucutres observed- particularly when framed against clear support and resistance levels – here’s the GPRO hourly
The market structure suggests the probable motion ahead in the coming days-
A likely failure of any tests beyond 34.70 -34.90 (intraday shorting range if smaller time frames show a breakdown of momentum) but weak support at 32.3 level. The overall form suggests the chart will dip a leg lower or retest its lows before attempting any kind of bounce action above 35. Too many trapped buyers underwater here for this one to have a clean bounce and support levels have not been properly tested. Momentum behavior suggests that buyers do not possess enough power currently to present a clean long.
When this chart breaches and holds 35 on greater momentum, I will look for a long at the 34 area. If the chart fails 32, I will look for a short at the 33 region. But for now, I need to wait. I will update the post on this one as I am watching it for the trade. Take away here? Patience is necessary in any good setup that continues.
In markets without trend, or without power within smaller trends, it is important to define entries, exits, and shifting stops to control exposure to risk.
My trading style is this – I don’t care about catching bottoms or catching tops – I care about entering into trades that hold into my targets. The targeted approach leaves me a great win rate and a measure of consistency that makes me a very confident trader. If I don’t have confidence, I don’t trade well. So I manufacture spaces that give me confidence- and it becomes a self fulfilling event-creating opportunities for my successes.
If you want to learn how to structure your trades like this, I’ll teach you in The Trading Vault
* no relevant positions