In this post I will show you a strategy that can be long and short financials at the same time and end profitably. The concept is based on pairing instruments that have different natures.
The nature of leveraged instruments is to increase the impact of one-way movements. The nature of unlevered broad-based indexes/funds tends to have more reversion and overlapping price movement.
In order to eliminate any curve fitting or algorithmic voodoo, I’m going to simply apply a long/short signal using a 20-period exponential average on both instruments. The signals are to buy a new 60-minute high above the 20 EMA and short a new 60-minute low below the EMA.
The two instruments in this example are XLF (unleveraged financials ETF), FAS (triple leveraged financials ETF). First, I will show you the exact same strategy on both instruments using a $10,000 nominal position size for each. Here are the results of the past 2+ years:
Please note: All examples are hypothetical; simulated using historic data.
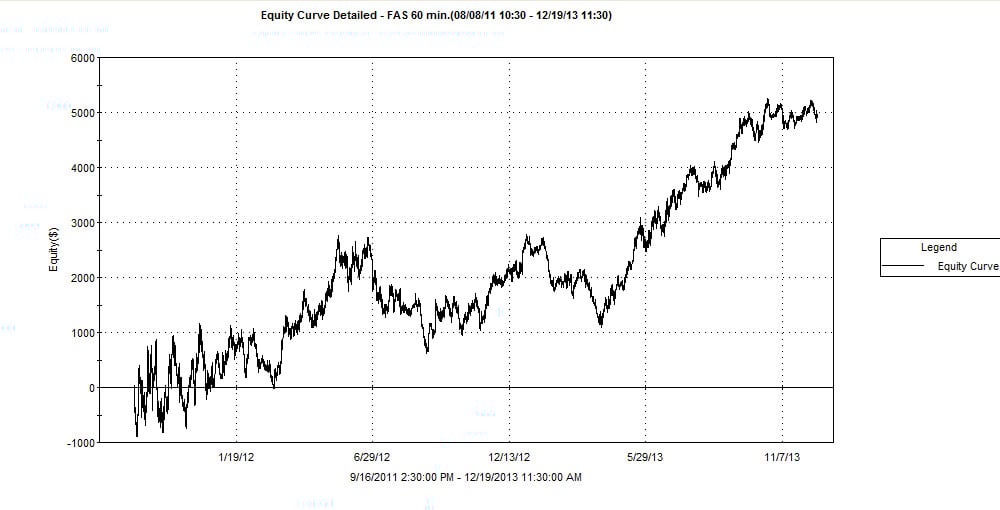
FAS (click to see full size)
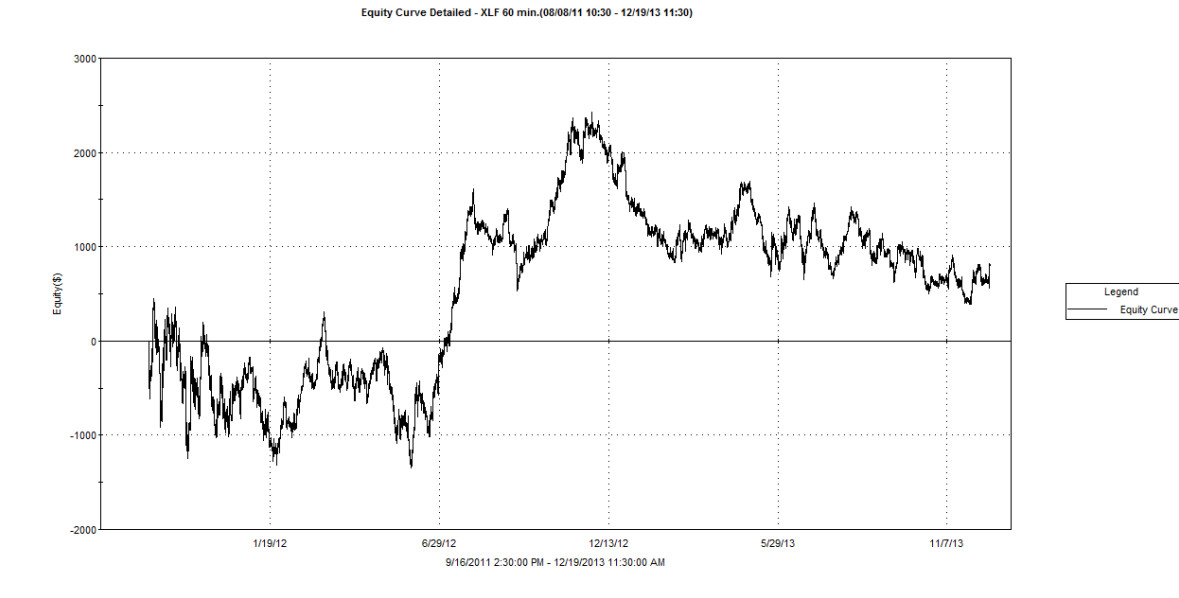
XLF
Using the same signal parameters on these two financial ETFs creates different results. They largely track the same in regards to periods of stronger and weaker performance. However, XLF could not accumulate enough profits in the good times to offset the bad.
If we switch XLF to be a contrarian strategy that is paired with the FAS trend strategy then we can begin to take advantage of the nature of each instrument.
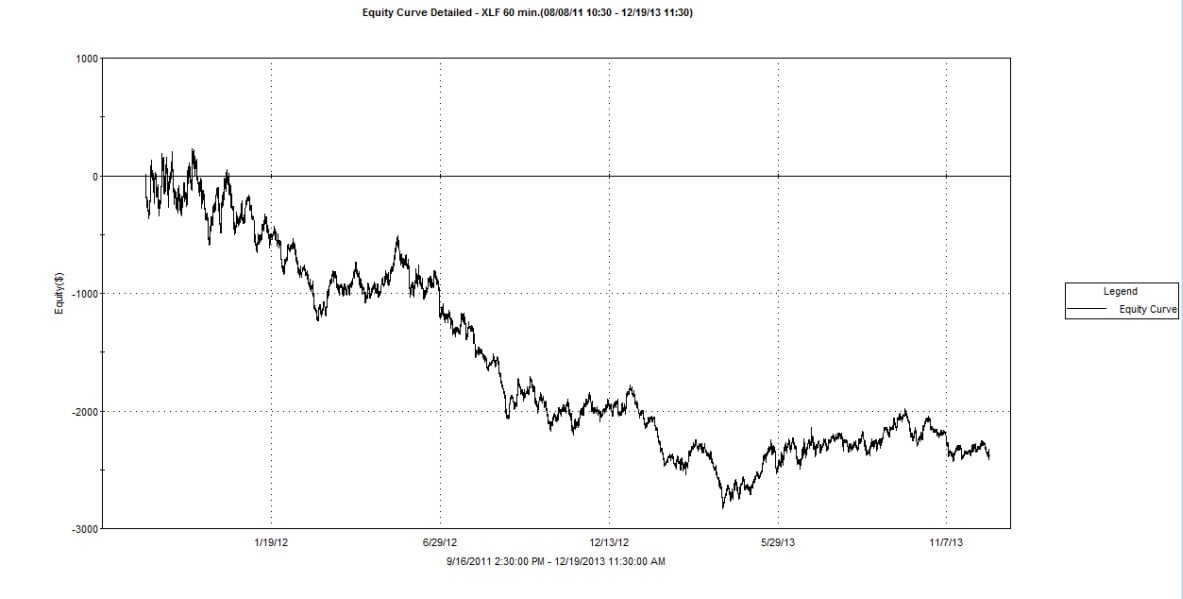
The contrarian strategy that I am applying to XLF is very simple: buy the new 50-bar low and short the new 50-bar high. Here are the results of this strategy over the same time frame:

This is still nothing to write home about, but let’s combine the two strategies to see how the two-instrument portfolio looks as a combined strategy.
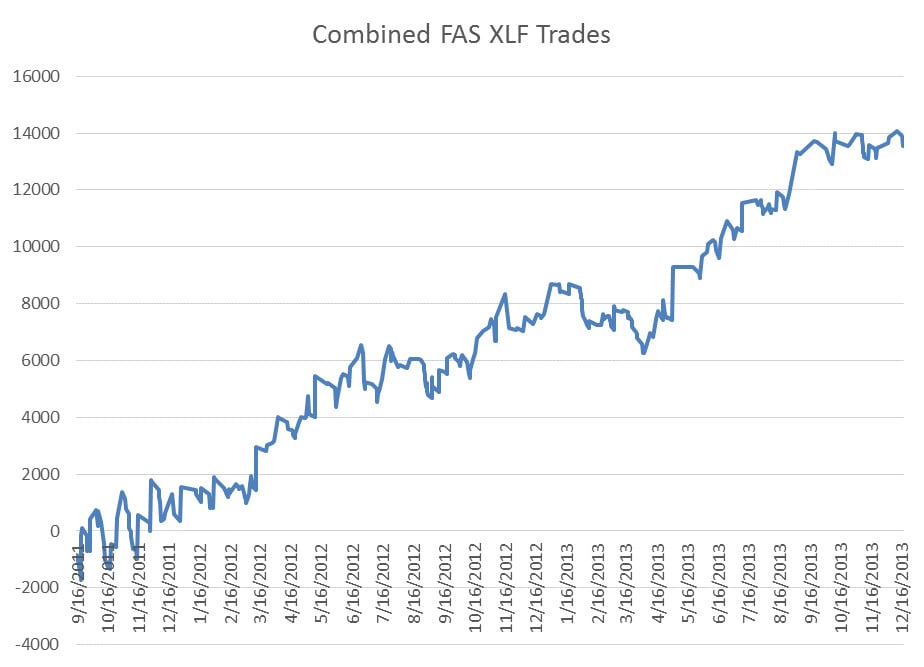
Each individual chart had drawdowns that were hard to swallow, but it becomes clear that there is a benefit to pairing good reversion strategy/instruments with good trend strategy/instruments. The net hypothetical result was about 30% per year with a max drawdown just over 10%.
These strategies were oversimplified to show how the nature and volatility of different instruments can be used to build opposing strategies that do not hedge away possible gains but, rather, can hedge away volatility of returns.
As Rick Martin and I prepare the Automated Systems courses, we will be including a lot of information about how to use multiple strategies that work together to achieve solid returns with minimal drawdowns.
Ideally a portfolio like this includes a lot more than two instruments. As you begin to mix in additional ETFs, equities, and other instruments; then you have the opportunity to see the P&L curve flatten out even more. As the curve gets flatter, then you can begin adding more size and even apply leverage. More on that later.
Follow me on twitter @andrew_falde and email any questions to Andrew Falde: [email protected]
No relevant positions
Please note: Hypothetical computer simulated performance results are believed to be accurately presented. However, they are not guaranteed as to accuracy or completeness and are subject to change without any notice. Hypothetical or simulated performance results have certain inherent limitations. Unlike an actual performance record, simulated results do not represent actual trading. Since, also, the trades have not actually been executed; the results may have been under or over compensated for the impact, if any, of certain market factors such as liquidity, slippage and commissions. Simulated trading programs in general are also subject to the fact that they are designed with the benefit of hindsight. No representation is being made that any portfolio will, or is likely to achieve profits or losses similar to those shown. All investments and trades carry risks.